

- High trading volume and intense momentum have boosted Aave crypto higher.
- The token is poised to surpass the psychological $200 level soon.
Aave (AAVE) is up 44.9% since the open on Tuesday, October 5, after testing the 50% retracement level at $125 a day earlier.
In a previous report from AMBCrypto, it was highlighted that price action over a longer time frame meant that AAVE’s bias was strongly bullish.
However, the speed of this bullish reaction was not anticipated.
It appears that the DeFi sector as a whole has been supported by the pro-crypto US president over the next four years, with DeFi tokens seeing gains of 30% or more in recent days.
Aave breaks structure on high volume
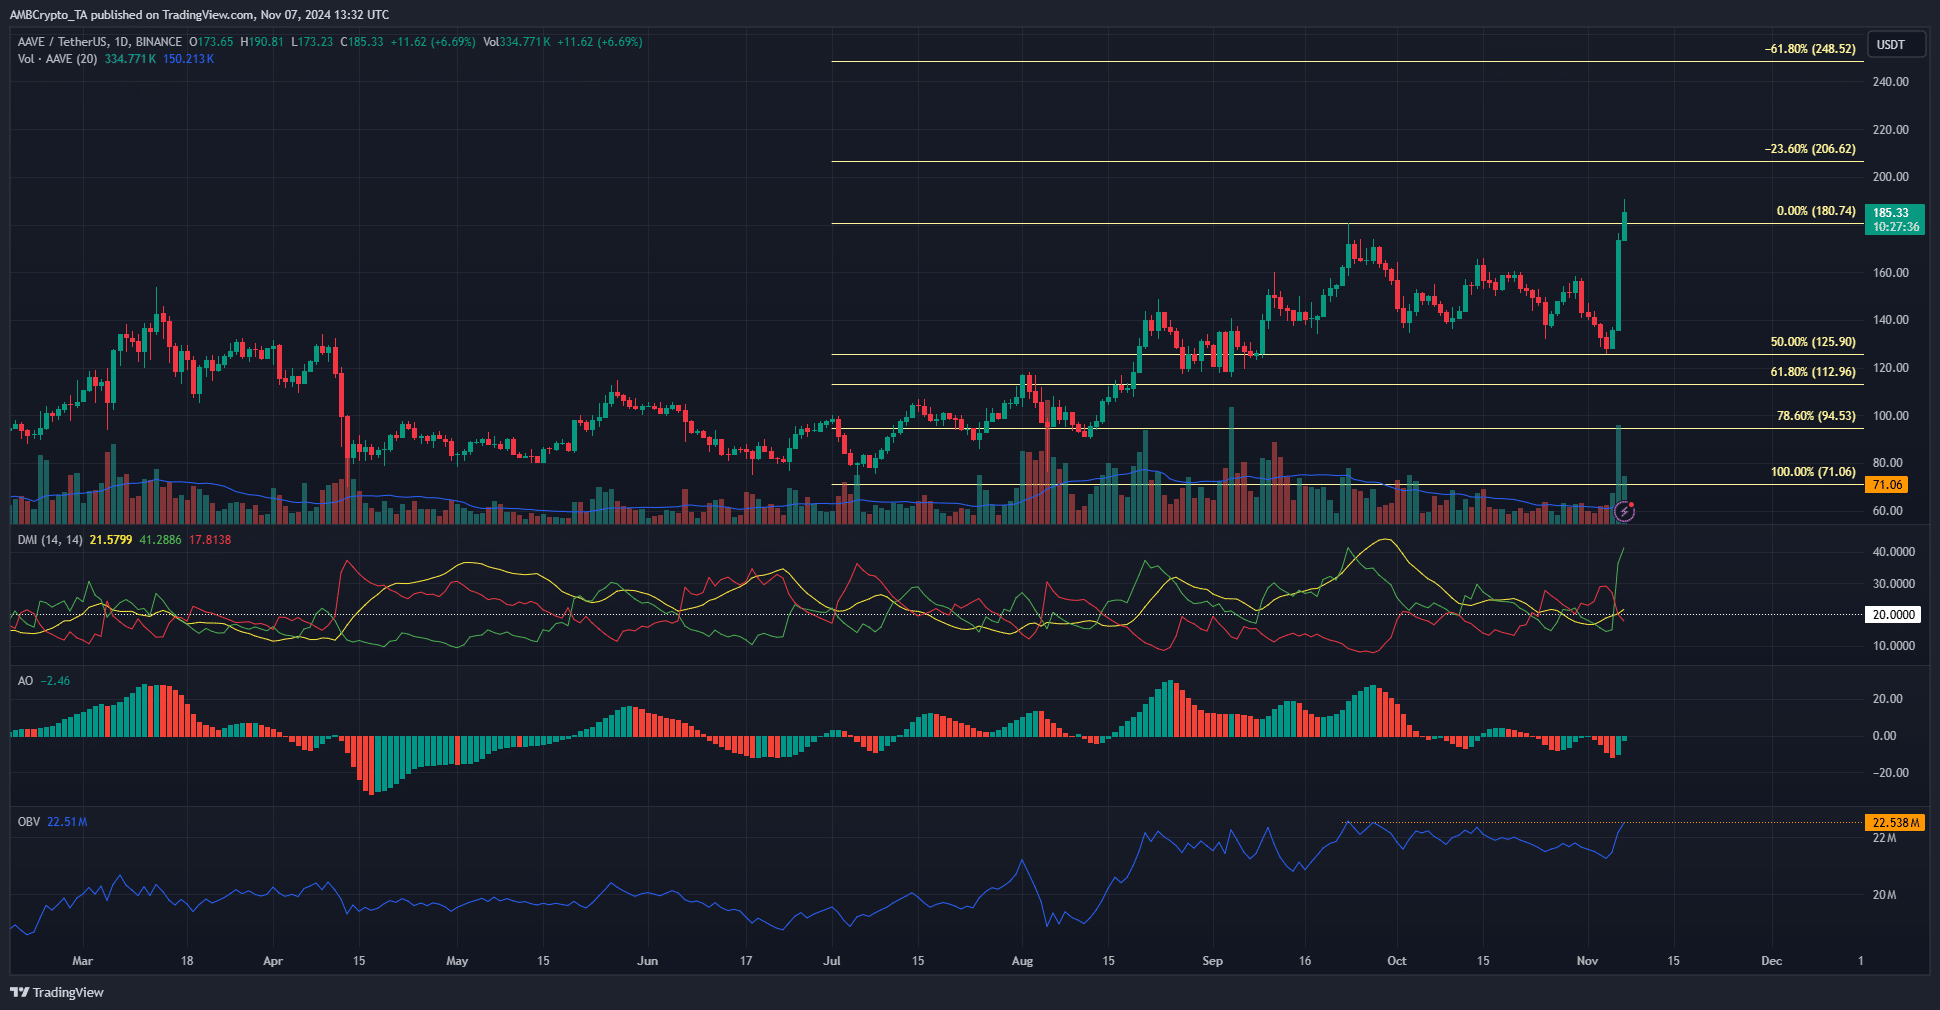
Source: AAVE/USDT on TradingView
The current day’s price, if it closes above $180.74, will signify a bullish breakout of the market structure on the daily chart of AAVE.
After the retracement towards $125 since mid-September and the failure of the recovery as Bitcoin (BTC) climbed higher, this breakout could justify the HODLer’s conviction.
The Awesome Oscillator has consistently shown momentum to be slightly bearish, due to the altcoin’s recent bearish momentum before the rebound.
Another encouraging sight was the OBV knocking on the doors of a local summit starting in September.
The DMI showed a strong uptrend as the ADX (yellow) and +DI (green) both rose above 20. From a price action perspective, the next profit-taking targets are of $245 and $290.
Consolidation phase for Aave crypto?
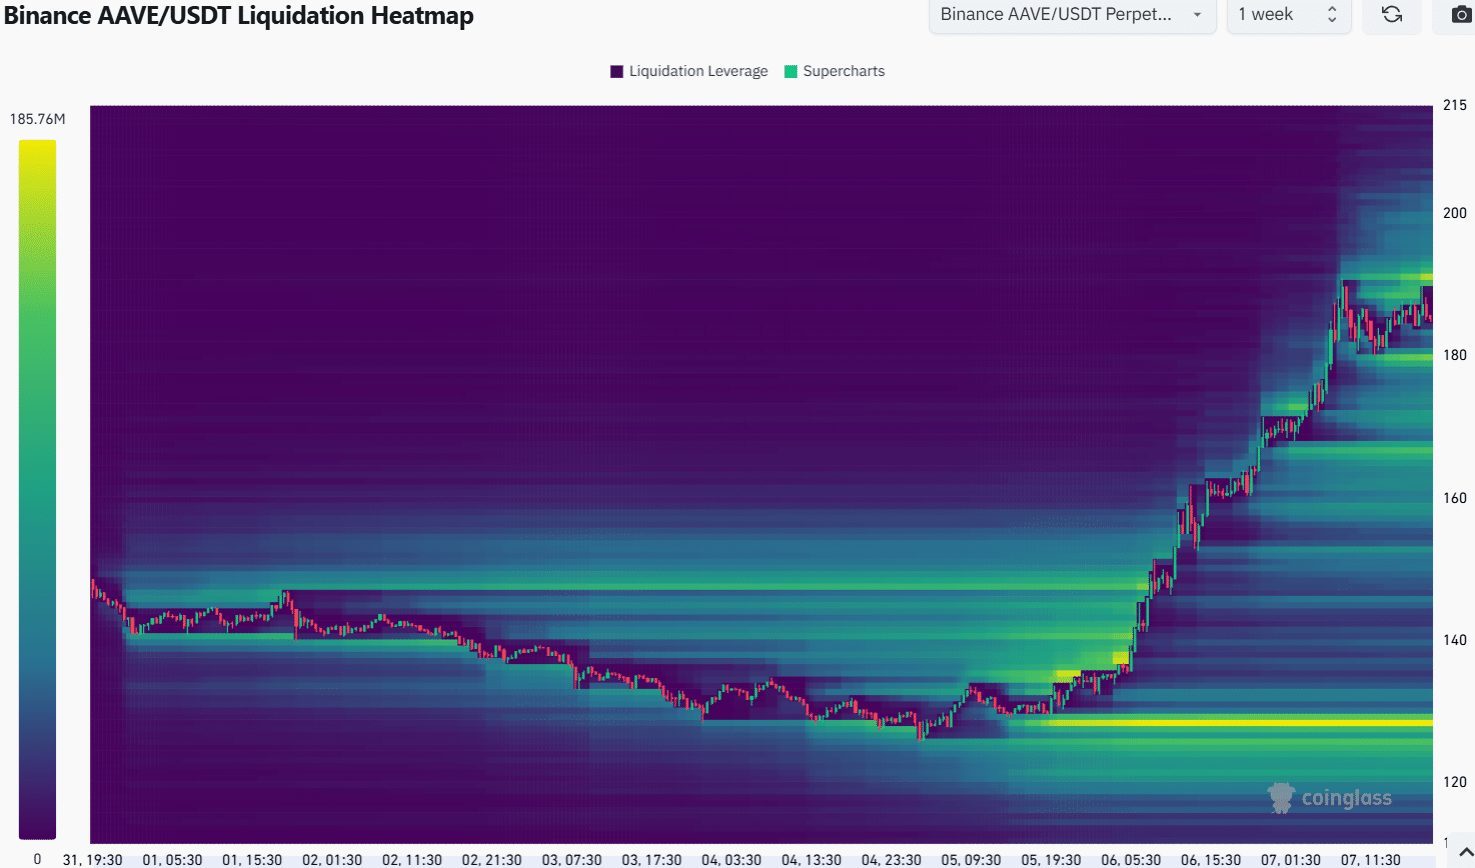
Source: Coinglass
AMBCrypto found that the retracement towards $125 collected a good amount of liquidity on the 3-month lookback heatmap. The $103 pocket has not been tested.
AMBCrypto’s examination of the 3-day chart showed that while prices were soaring, liquidity at $130 was getting thicker.
Is your wallet green? Check out the Aave Profit Calculator
Price action in the late hours of November 5 prompted more traders to take long positions. Rapidly surpassing two-month highs saw new liquidity bands forming at $167, $179, and $191.
The $179 and $191 area could form a short-term range, giving the Aave crypto a chance to recover before its next upward impulse.
Disclaimer: The information presented does not constitute financial, investment, business or other advice and represents the opinion of the author only.