

- The fate of APT largely depends on whether the bulls can successfully defend the $10.35 support.
- Traders should watch for a potential rebound, which could target $13.75, or a breakdown.
Aptos (APT) continued its strong climb for three months before hitting a 7-month high of $13.75 on November 11th.
However, its recent rejection of trendline resistance has put APT in a critical position, with bulls looking to defend a confluence of key support levels.
APT could follow this path from its immediate support level
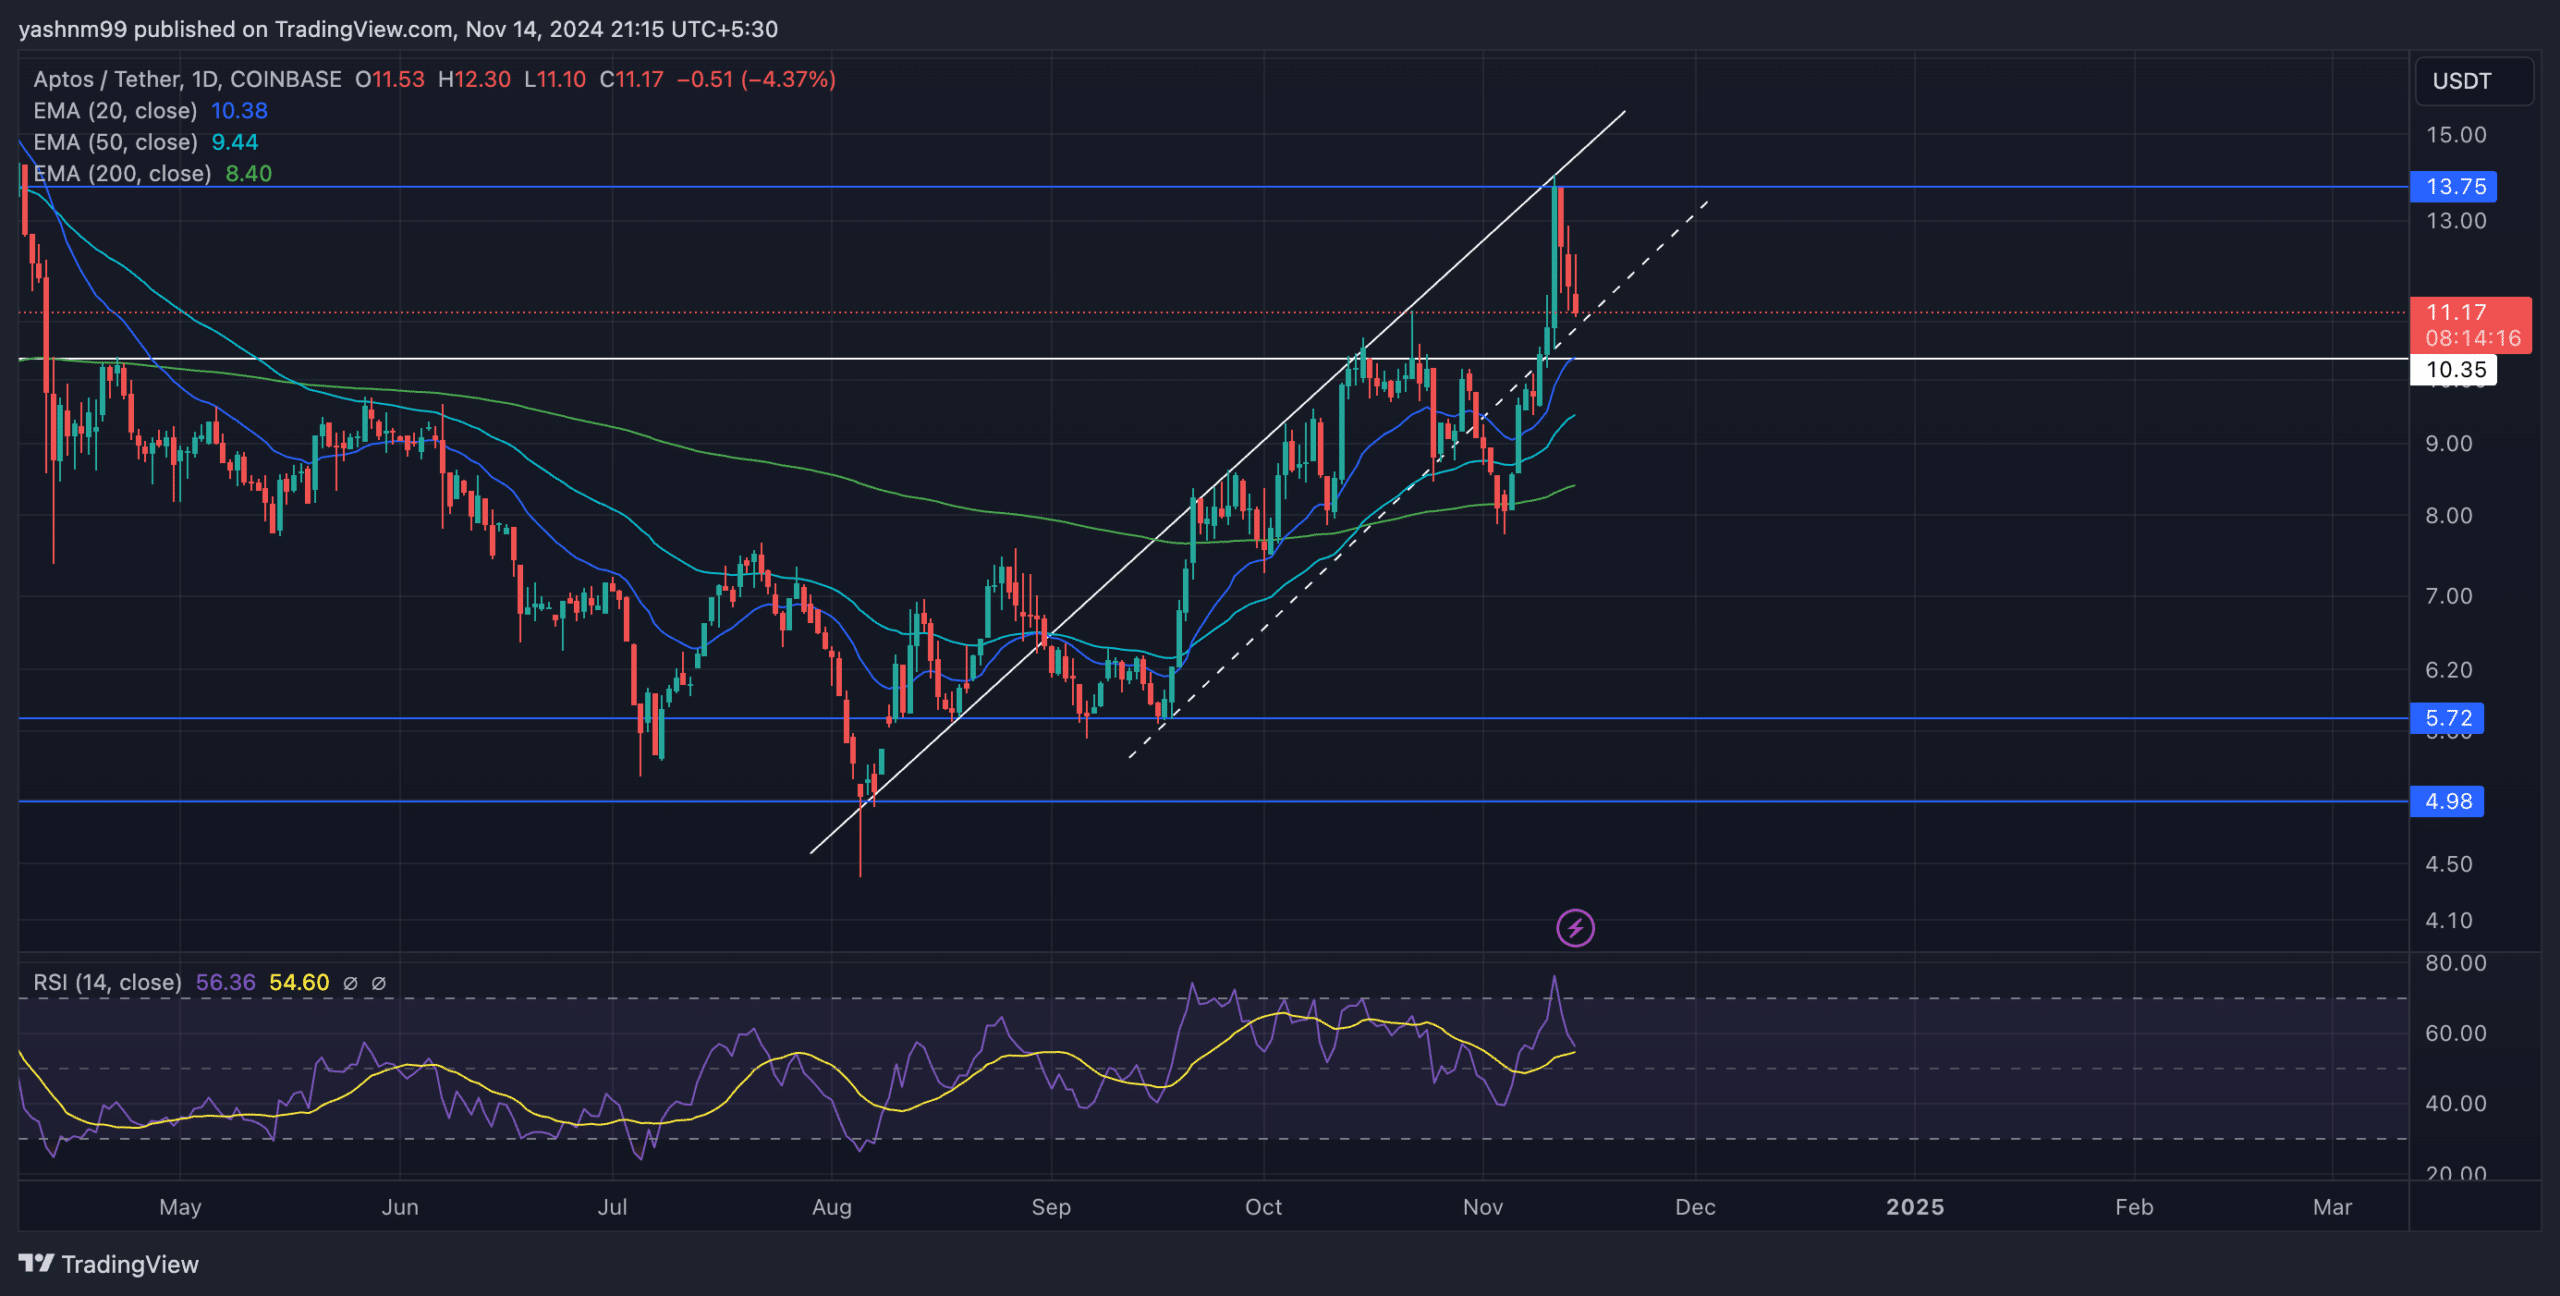
Source: TradingView, APT/USDT
At press time, Aptos was trading at around $11.11 after a decline of nearly 8.7%. Price was once again testing a confluence of supports near the $10.35 area, including horizontal support, the ascending trendline, and the 20-day EMA. The outcome of this retest could define the direction of APT’s future trend.
If APT bounces off the $10.35 level, buyers could aim for a quick retest of the $13.75 resistance, coinciding with the upper trendline of the ascending channel. A successful close above this level could propel APT towards a potential upside target near the $15 mark, further strengthening the bullish bias.
However, if the price breaks below the confluence of support, APT could experience a consolidation phase near the 50-day EMA ($9.43) and the 200-day EMA ($8.40). This would suggest a lack of dynamism among buyers. Failure to hold the $10.35 support could open the possibility of a move towards the $8 area.
The relative strength index (RSI) stood at around 56, reflecting traders’ indecision. A definitive move below 50 could indicate renewed bearish momentum, while a jump below 60 could trigger more bullish pressure.
Analyze APT derivatives data

Source: Coinglass
APT derivatives data highlighted mixed sentiment in the market. Open interest fell 11.96% to $251.35 million, indicating that traders closed their positions, likely due to uncertainty over APT’s next move. Likewise, trading volume fell by 25.99% – a sign of reduced trader participation.
Interestingly, Binance’s long/short ratio stood at 3.07, while OKX had a ratio of 2.39 – revealing an optimistic bias among traders on these major platforms. However, the 24-hour long/short ratio was 0.8886, implying that slightly more traders were leaning toward short positions.
In the liquidation data, long positions dominated, with around $2.36 million in liquidations, suggesting a continued effort by bulls to maintain their positions amid the recent decline.
Given the current mixed sentiment and key indicators pointing to indecision, it is important to consider Bitcoin’s movement and broader market trends before taking action on APT.