

- COMP has a strongly bullish outlook on the longer time frames.
- In the short term, a price decline between $108 and $110 is likely.
Compound (COMP) was on a strong uptrend after breaking the 4-month high at $54.6. On Wednesday, November 4, the COMP gained 37.7%, going from $87.34 to $120.28. The price had climbed as high as $144, but the selling pressure forced the bulls to retreat.
Despite the recent massive gains, the compound crypto is still down 87% from its all-time high of $910.5, set in May 2021.
The recent trend of older tokens such as Stellar (XLM), Algorand (ALGO), and Ripple (XRP), dubbed “dino tokens” by some market participants due to their seniority in the crypto ecosystem, could be followed. by the trend of DeFi tokens such as COMP experiencing a rapid rally.
Compound Crypto Surpasses March High to Set New Yearly High
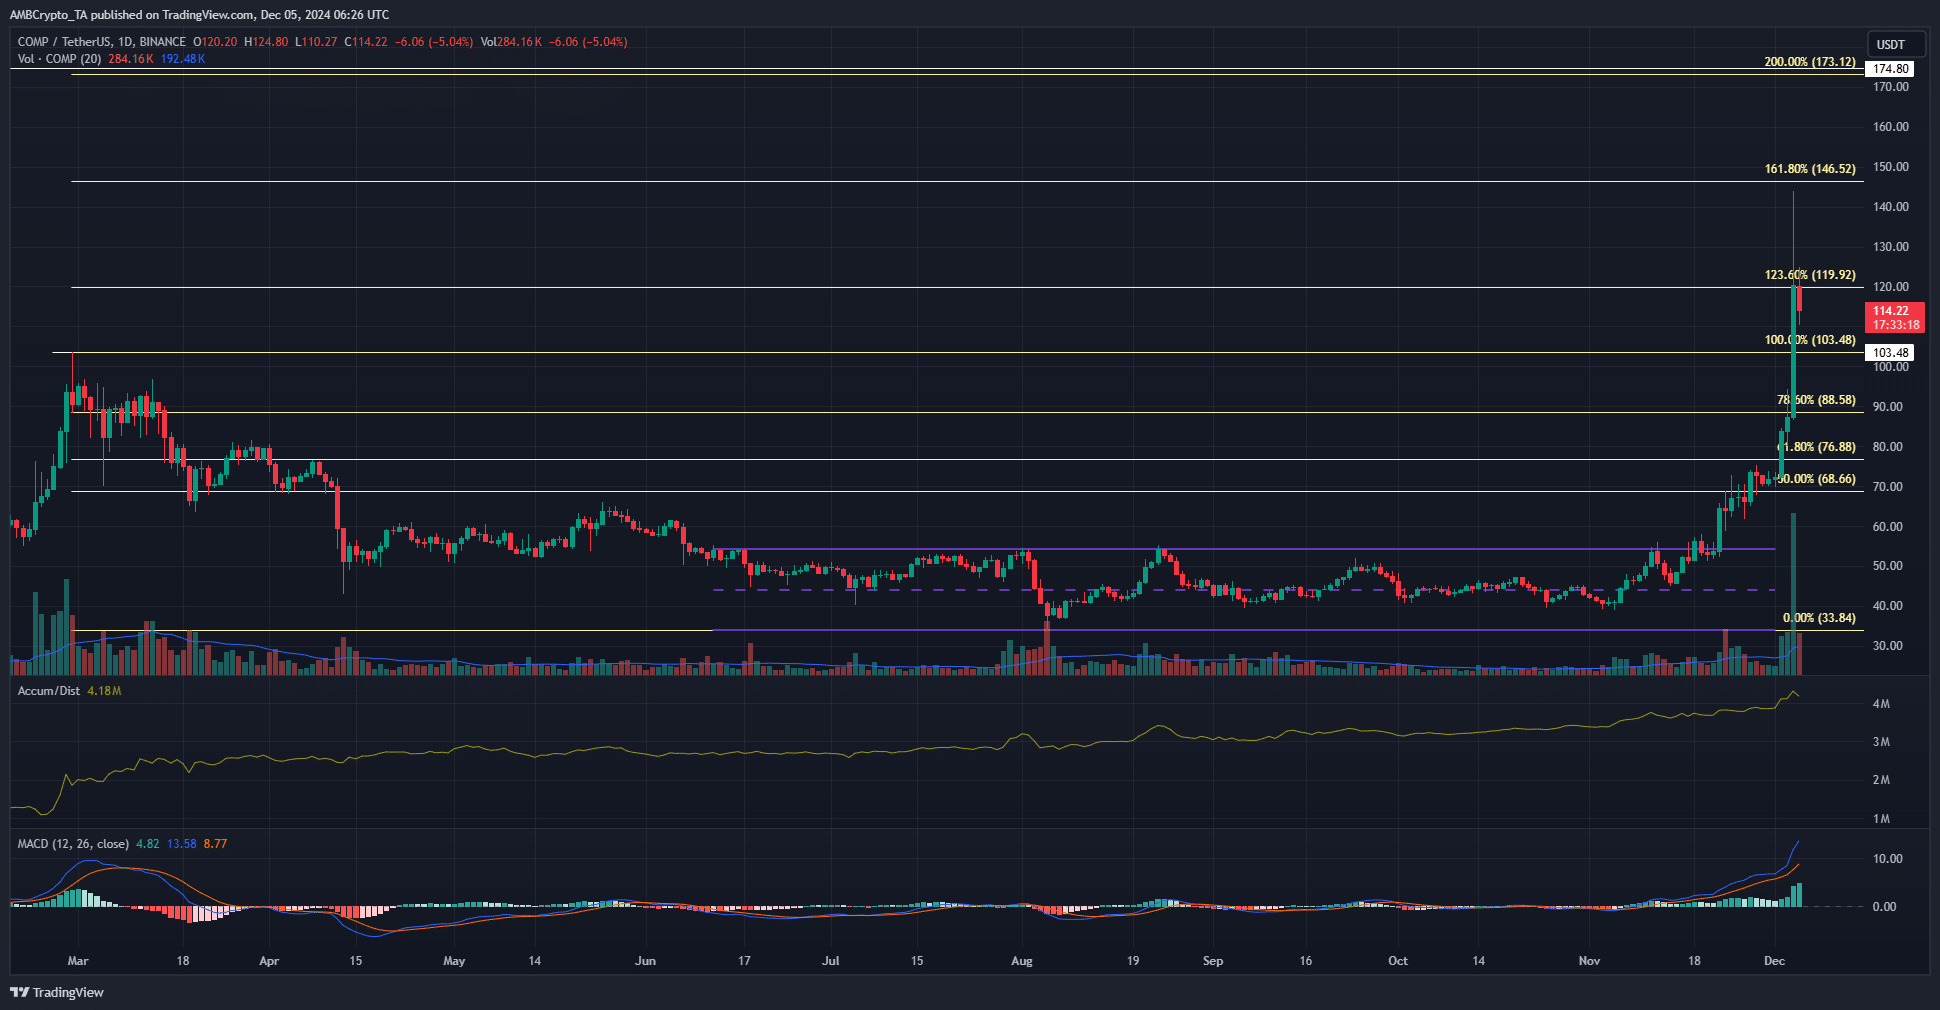
Source: COMP/USDT on TradingView
Using the downtrend from March to August, a set of Fibonacci retracement levels were plotted. The compound crypto has returned all the way to $33.8, the area it had been trading in in September 2023.
This retracement was followed by a consolidation phase around the $40 mark. The range formation extends from $33.84 to $54.44, with a midpoint at $44.36.
The multi-month consolidation around the $40 mark gave bulls time to force a strong rally in the second half of November.
Since the November 22 range breakout that saw the token reach $64.6 that day, the composite crypto is up 77%. The A/D indicator was in a consistent uptrend in recent months, even as prices consolidated, indicating accumulation. The MACD also showed strong bullish momentum.
The 123.6% extension level at $119.9 served as resistance at press time. In the near term, the $108 and $90 levels should act as support.
Price forecast for 2025
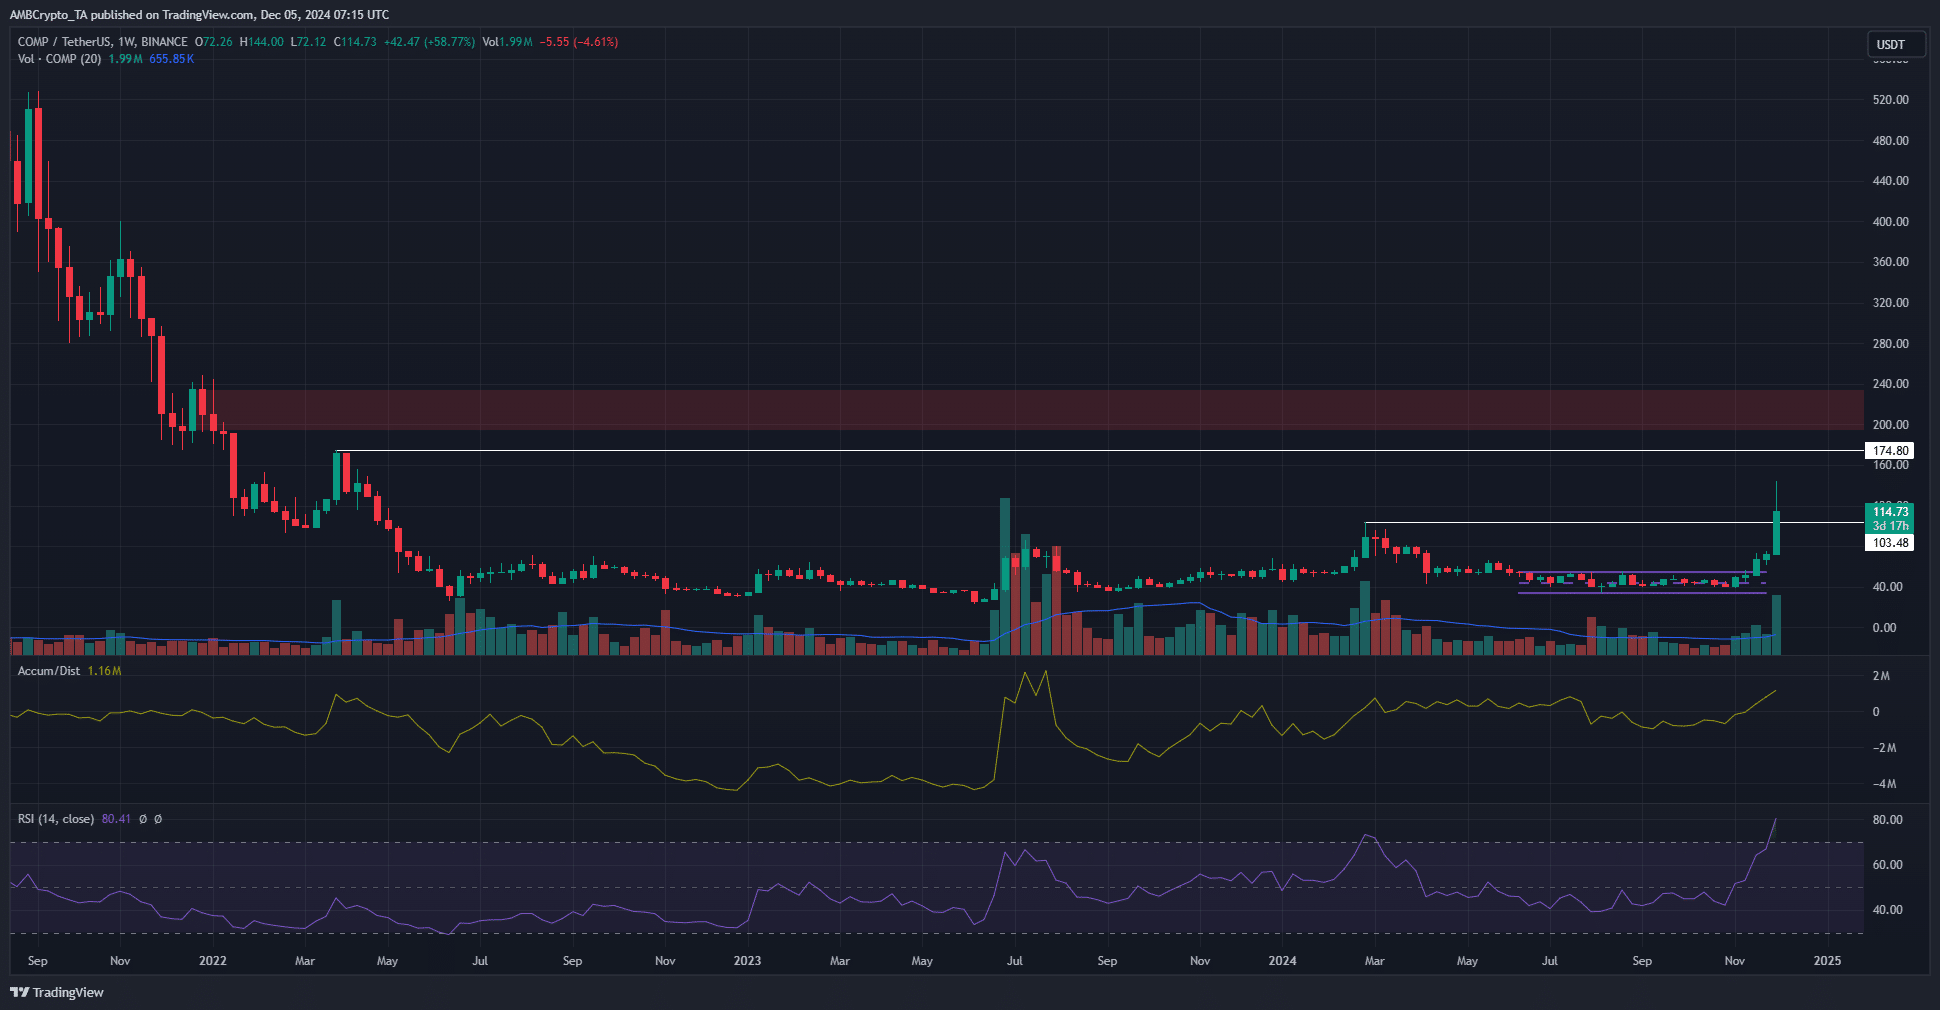
Source: COMP/USDT on TradingView
The weekly chart showed that the main weekly resistance at $103.48 was in the process of being broken. A weekly session closing above would be a strong sign. To the north, the next resistance levels are at $174.8, $200 and $235.
Read Compound (COMP) Price Forecast 2024-25
The A/D indicator was also in a consistent uptrend on the weekly time frame. Meanwhile, the RSI was at 80, above all highs in almost four years. It is likely that the compound crypto will reach $200 in the coming weeks.
Sustained buying pressure is needed to propel it past $235, and it’s unclear whether Compound can muster enough buyers to go beyond that. Breaking above $235 will pave the way for much higher targets, such as the $500 level.
Disclaimer: The information presented does not constitute financial, investment, business or other advice and represents the opinion of the author only.