

- Virtuals Protocol, Aave and Chainlink were the biggest gainers last week.
- Dogwifhat, Brett and Bonk were the biggest losers at the other end of the table.
This week, Virtual Protocol (VIRTUAL) became the best performing asset, gaining 39.80%, while Aave (AAVE) and Chainlink (LINK) also generated impressive returns.
However, the week was not without its losers, with memecoins topping the charts and facing notable declines.
The biggest winners
Virtual protocol (VIRTUAL)
The virtual protocol became the best performing asset last week, seeing an increase of 39.80%, according to data from CoinMarketCap. It started the week positively, up 2.65% to trade around $1.70.
The uptrend accelerated between December 11 and 13, where strong buying pressure pushed the price to a high of $2.45.
This rapid rise reflects strong market sentiment and bullish activity, further supported by increasing trading volume.
By the end of the week, the price stabilized around $2.45 despite a slight decline of 0.19%, signaling a brief profit-taking phase.
The steady increase in volume highlights continued investor interest. Its volume is down more than 32% as of this writing and now stands at around $205 million.
Aave (AAVE)
AAVE became the second biggest gainer last week, posting an impressive 29.49% increase. The asset started the week slightly higher, trading around $282.85, reflecting early signs of bullish momentum.
AAVE’s price action reached a turning point on December 12, with a strong 21.20% rise that propelled its value to a weekly high of $367.10, driven by strong market demand and the increase in transaction volumes.
Despite its strong performance, AAVE saw slight selling pressure towards the end of the week, settling at $365.49 after a 3.24% decline.
The price correction suggests some profit taking but remains in an overall bullish structure. If AAVE holds above $360, it could attempt to retest its recent high, with $340 as a critical support level to watch.
Chain link (LINK)
Chainlink (LINK) became the third biggest gainer last week, registering a 12.66% increase despite significant price fluctuations.
It started the week with a gain of 5.23%, trading around $26.10, signaling the start of bullish sentiment. However, the price faced a sharp decline the next day, dropping 14.57% to a weekly low of around $22.
This correction reflects profit-taking pressure but has failed to dampen the overall bullish outlook.
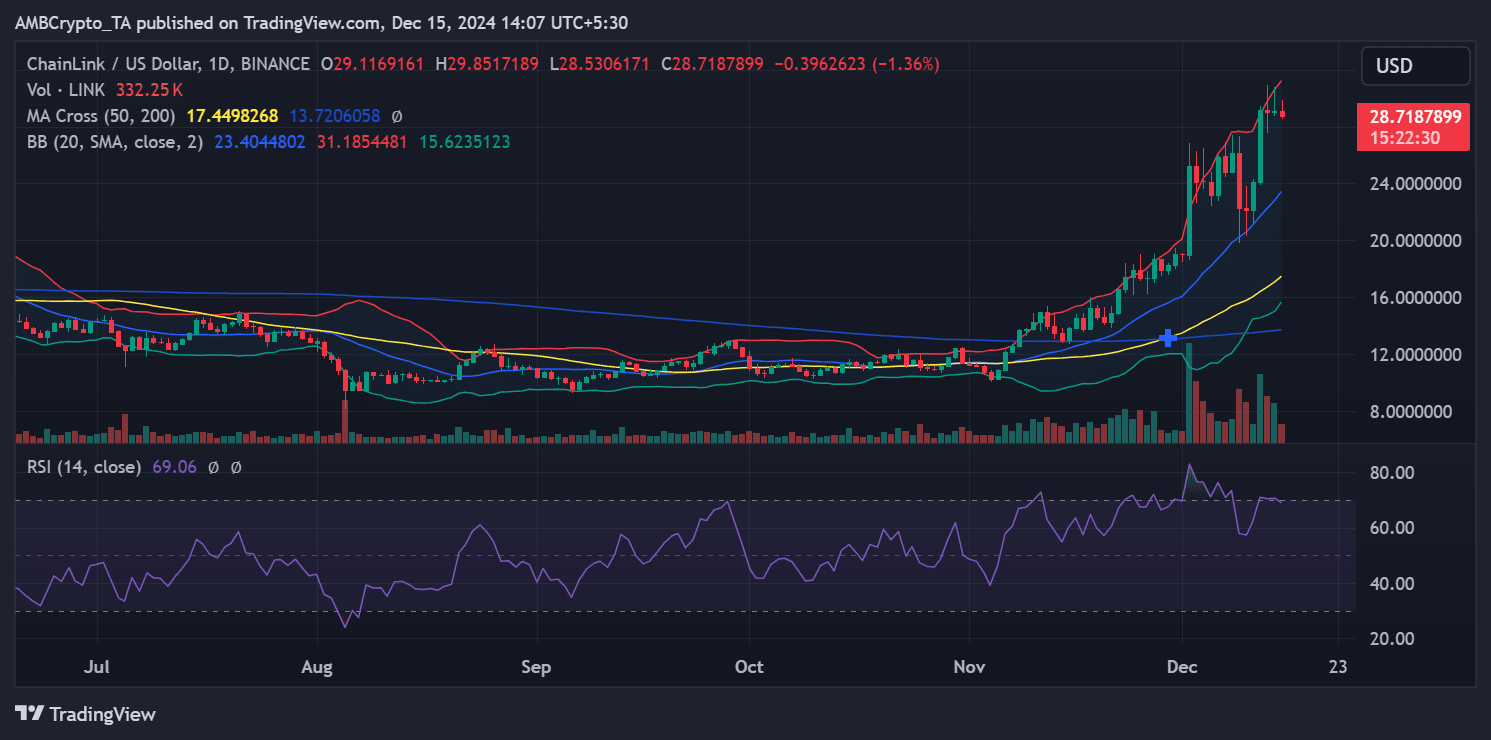
Source: TradingView
The major turning point came on December 12, when LINK saw an impressive 21.12% surge, catapulting its price to $29.00.
This strong recovery was accompanied by an increase in trading volume, a sign of renewed confidence and investor momentum.
By the end of the week, LINK stabilized at $29.11, recording a slight gain and consolidating its position as one of the best performing assets.
From a technical perspective, LINK remains above its 50-day moving average, acting as a key support level.
The relative strength index (RSI) was hovering around 69, close to overbought territory, suggesting cautious optimism about continued gains.
The upward trajectory of the 20-day Bollinger Bands reflects sustained volatility with room for further upside.
If bulls maintain their momentum, Chainlink could target the psychological resistance at $30, with the $28 level as immediate support.
A decisive move above $30 could open the door to further gains, while failure to hold support could trigger a slight pullback.
Top 1,000 winners
Outside of the top 100, this week’s top gainer, Black Agnus (FTW), surged more than 4,318%. The second and third biggest gainers were Solvex Network (SOLVEX) and Peezy (PEEZY), with over 3,965% and over 2,158% increases, respectively.
The biggest losers
Dog Hat (WIF)
WIF became the biggest loser last week, recording a decline of 27.07%. The bearish momentum started early, with a 4.18% decline on the first day of the week, taking its price towards $3.717.
This initial weakness was amplified on December 9, when WIF saw a substantial 18% decline, plunging all the way to the critical support level near $3.
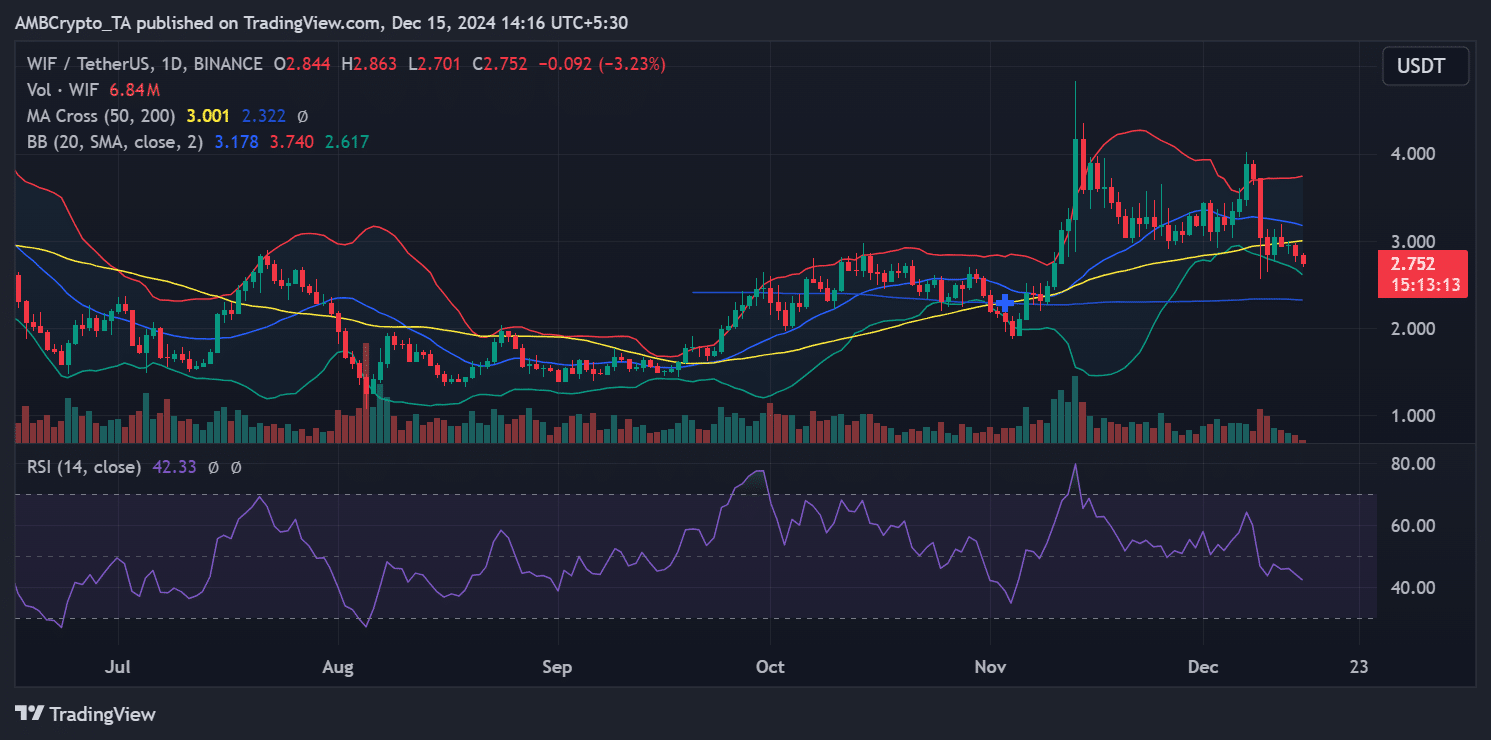
Source: TradingView
Despite intermittent attempts to stabilize, selling pressure persisted throughout the week. At the end of the week, WIF closed at around $2.844, recording an additional 3% decline to cap off its disappointing performance.
Additionally, the price fell below the 50-day moving average (currently near $3.00), signaling a bearish trend reversal. The 200-day moving average at $2.32 is now the next critical support level.
Meanwhile, the Relative Strength Index (RSI) is hovering around 42.33, indicating that WIF is approaching oversold territory but is not yet ready for a significant reversal.
Bollinger bands suggest increased volatility, with WIF trading closer to the lower band, signaling continued bearish momentum.
If the bearish forces continue, WIF could retest the support at $2.50. A rebound above $3.00 would be essential to any near-term recovery.
Brett (BRETT)
BRETT ranked as the second biggest loser last week, posting a notable decline of 23.79%.
The downtrend started on a moderate note, with a slight decline of 0.79% on the first day of the week, leaving the price hovering around $0.20.
However, the selling pressure intensified sharply on December 9, leading to a sharp decline of 17.81%, driving the price towards a key support level around $0.17.
Despite brief attempts to stabilize, bearish forces dominated the rest of the week. By the close of the week, BRETT had fallen further to around $0.16, marking a further decline of 2.94%.
As of this writing, BRETT’s market cap is around $1.6 billion, down more than 8%.
Bonk (BONK)
BONK closed the week as the third biggest loser, posting a substantial decline of 23.32%. The bearish momentum started with a slight decline of 1.40%, placing its price near $0.00004590.
However, like other memecoins, the token saw a sharp correction of almost 15% the next day, falling to around $0.00003902.
Selling pressure intensified and by the end of the week, BONK had fallen further, closing at $0.00003645 after a 6.15% decline.
Technical indicators paint a clear and bearish picture of the outlook. BONK price is now trading below the 50-day moving average, signaling near-term weakness.
However, it remained above the 200-day moving average, hinting at potential long-term support. Volume data reveals significant sales activity, aligned with the downward trend.
Top 1,000 losers
Outside of the top 100, the biggest loser this week was HarryPotterObamaSonic10Inu 2.0 (BITCOIN), with a decline of over 99.91%. The second and third biggest losers were Trumpwifhat (TRUMP) and MICHI, down over 99%.
Conclusion
Here’s the weekly recap of the biggest winners and losers. It is essential to keep in mind the volatile nature of the market, where prices can change quickly.
So it is best to do your own research (DYOR) before making any investment decisions.