

- Polkadot formed a bearish head and shoulders pattern on its daily chart, which could precede a decline to $3.47.
- Polkadot network activity has also decreased significantly in recent times
Polka dot (DOT)at press time, was trading at $7.20 after gains of 2% in 24 hours. At the same time, the altcoin’s trading volume decreased by 9% to $290 million on the charts..
In fact, Polkadot is up 16% over the past seven days. And yet, bearish signs appear to have appeared on the altcoin’s daily chart recently – a sign that the price may be on the verge of a correction.
Polkadot forms a head and shoulders pattern
Polkadot formed a head and shoulders pattern on its daily chart, a pattern that typically precedes a strong downtrend.
Following its recent gains, DOT was attempting to rally at the crucial resistance at the neckline. However, it was repeatedly rejected at this resistance level, suggesting buyers have been inactive.
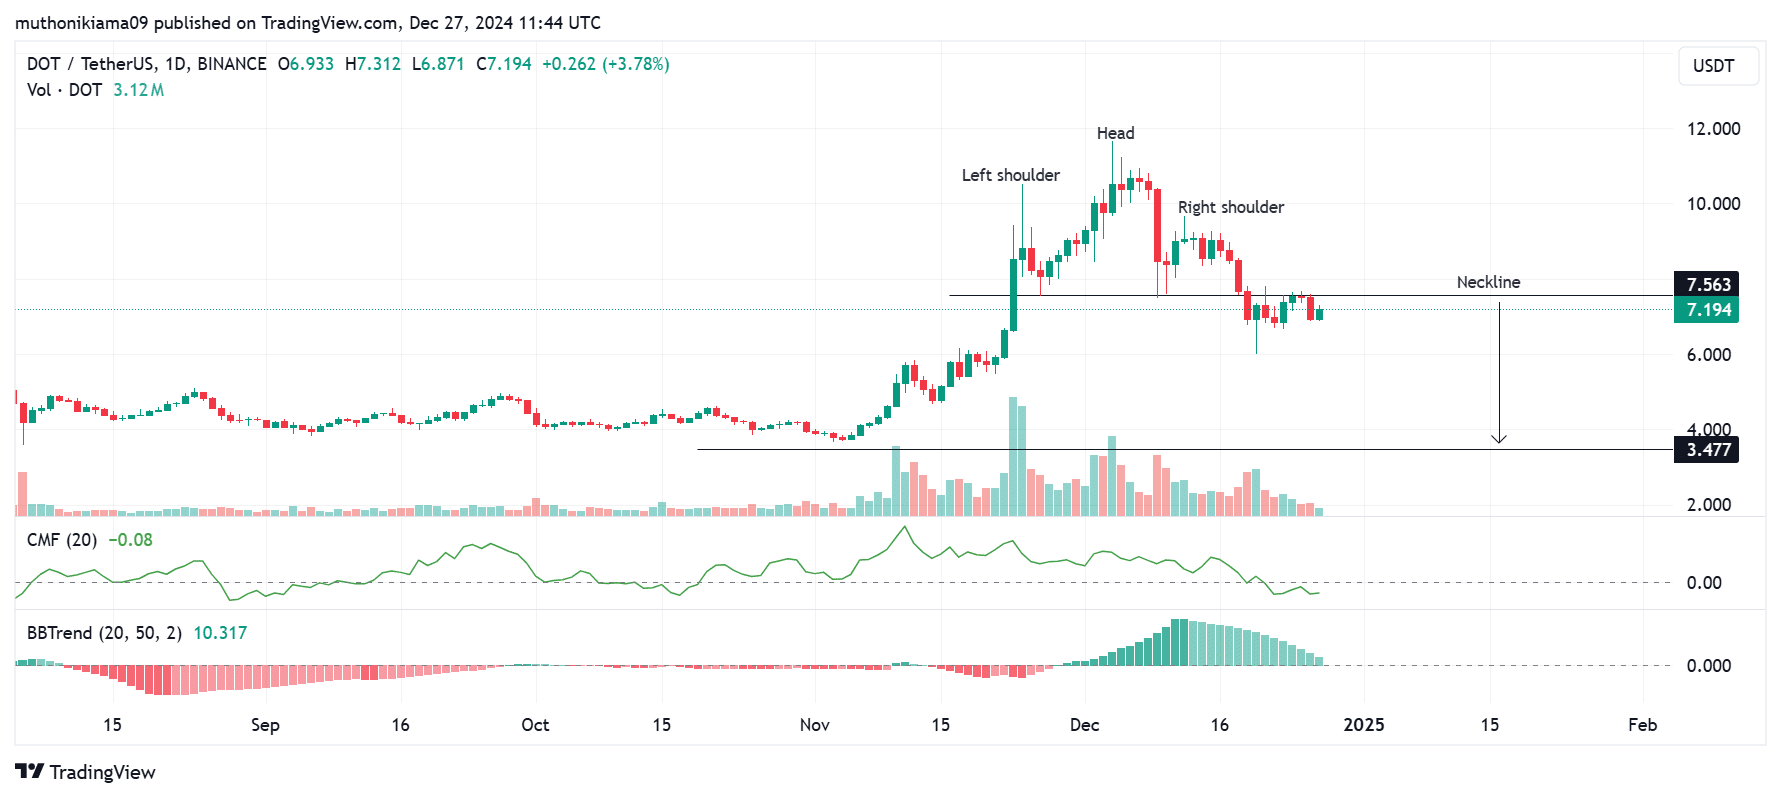
(Source: Tradingview)
If this resistance level remains strong and DOT is unable to breach it, sellers will likely enter the market, triggering a decline of over 50% towards $3.47.
The Chaikin Money Flow (CMF), which leaned south, revealed that selling pressure was greater than buying pressure. This highlighted bearish momentum that could push DOT lower.
The fading histogram bars on the Bollinger Band trend indicator also suggest that bullish momentum was weak. This could also set the stage for a downward trend if buyers fail to re-enter the market.
Buyers are likely waiting for a decisive break above the neckline at $7.56 to take new positions. If this happens, DOT could bounce towards the next resistance level at $9.20.
Decline in network activity could hamper gains
Polkadot’s network has seen a drop in activity, which could hamper gains. According to TokenTerminal, network metrics such as revenue and number of users are now at their lowest levels in several weeks.
The number of daily active users on the network also dropped to 4,200 – the lowest level in 30 days. At the same time, daily earnings fell to $1,118, indicating fewer people are using the network.
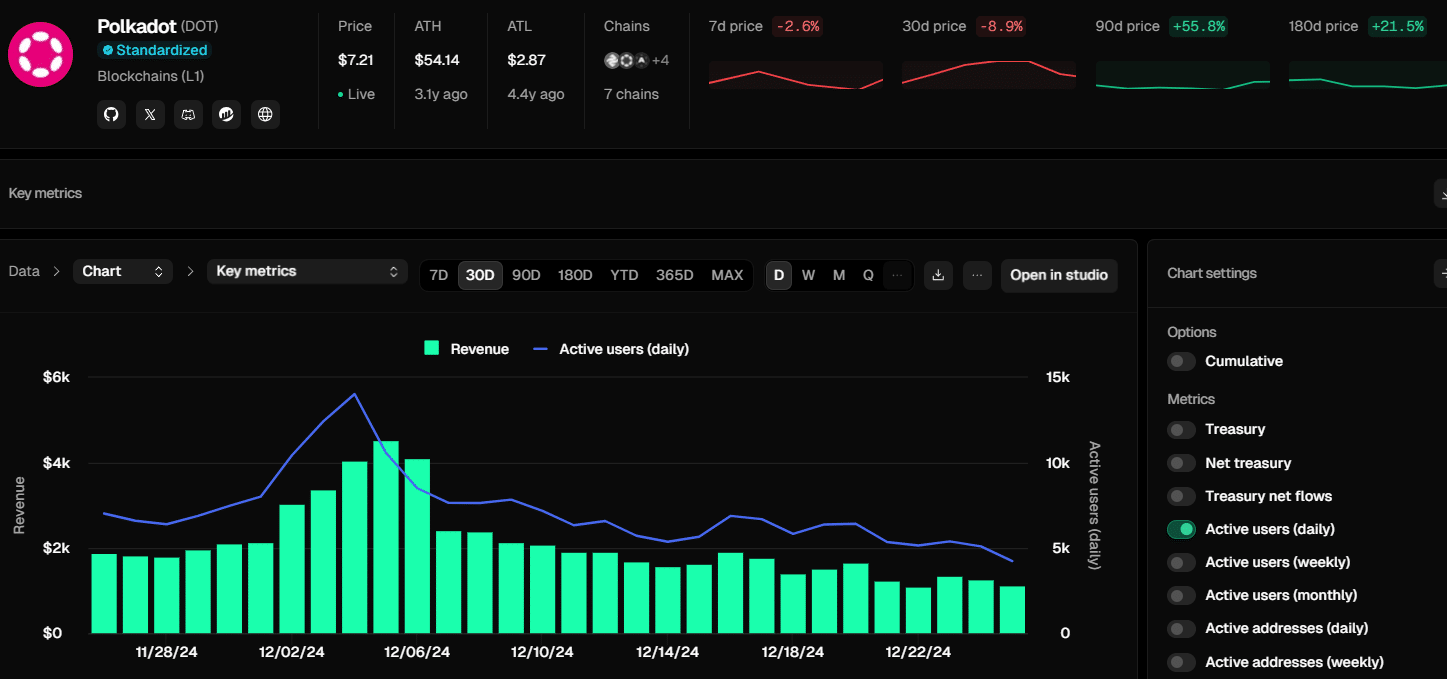
(Source: TokenTerminal)
If the network fails to see a recovery in activity, this could reinforce the downtrends. This will in turn cause DOT prices to fall on the charts.
DOT Liquidation Heat Map Suggests…
The Polkadot liquidation heatmap revealed that there are no immediate liquidation levels much higher or lower than the price at press time. If this scenario causes traders not to seek liquidity, it could lead to price consolidation.
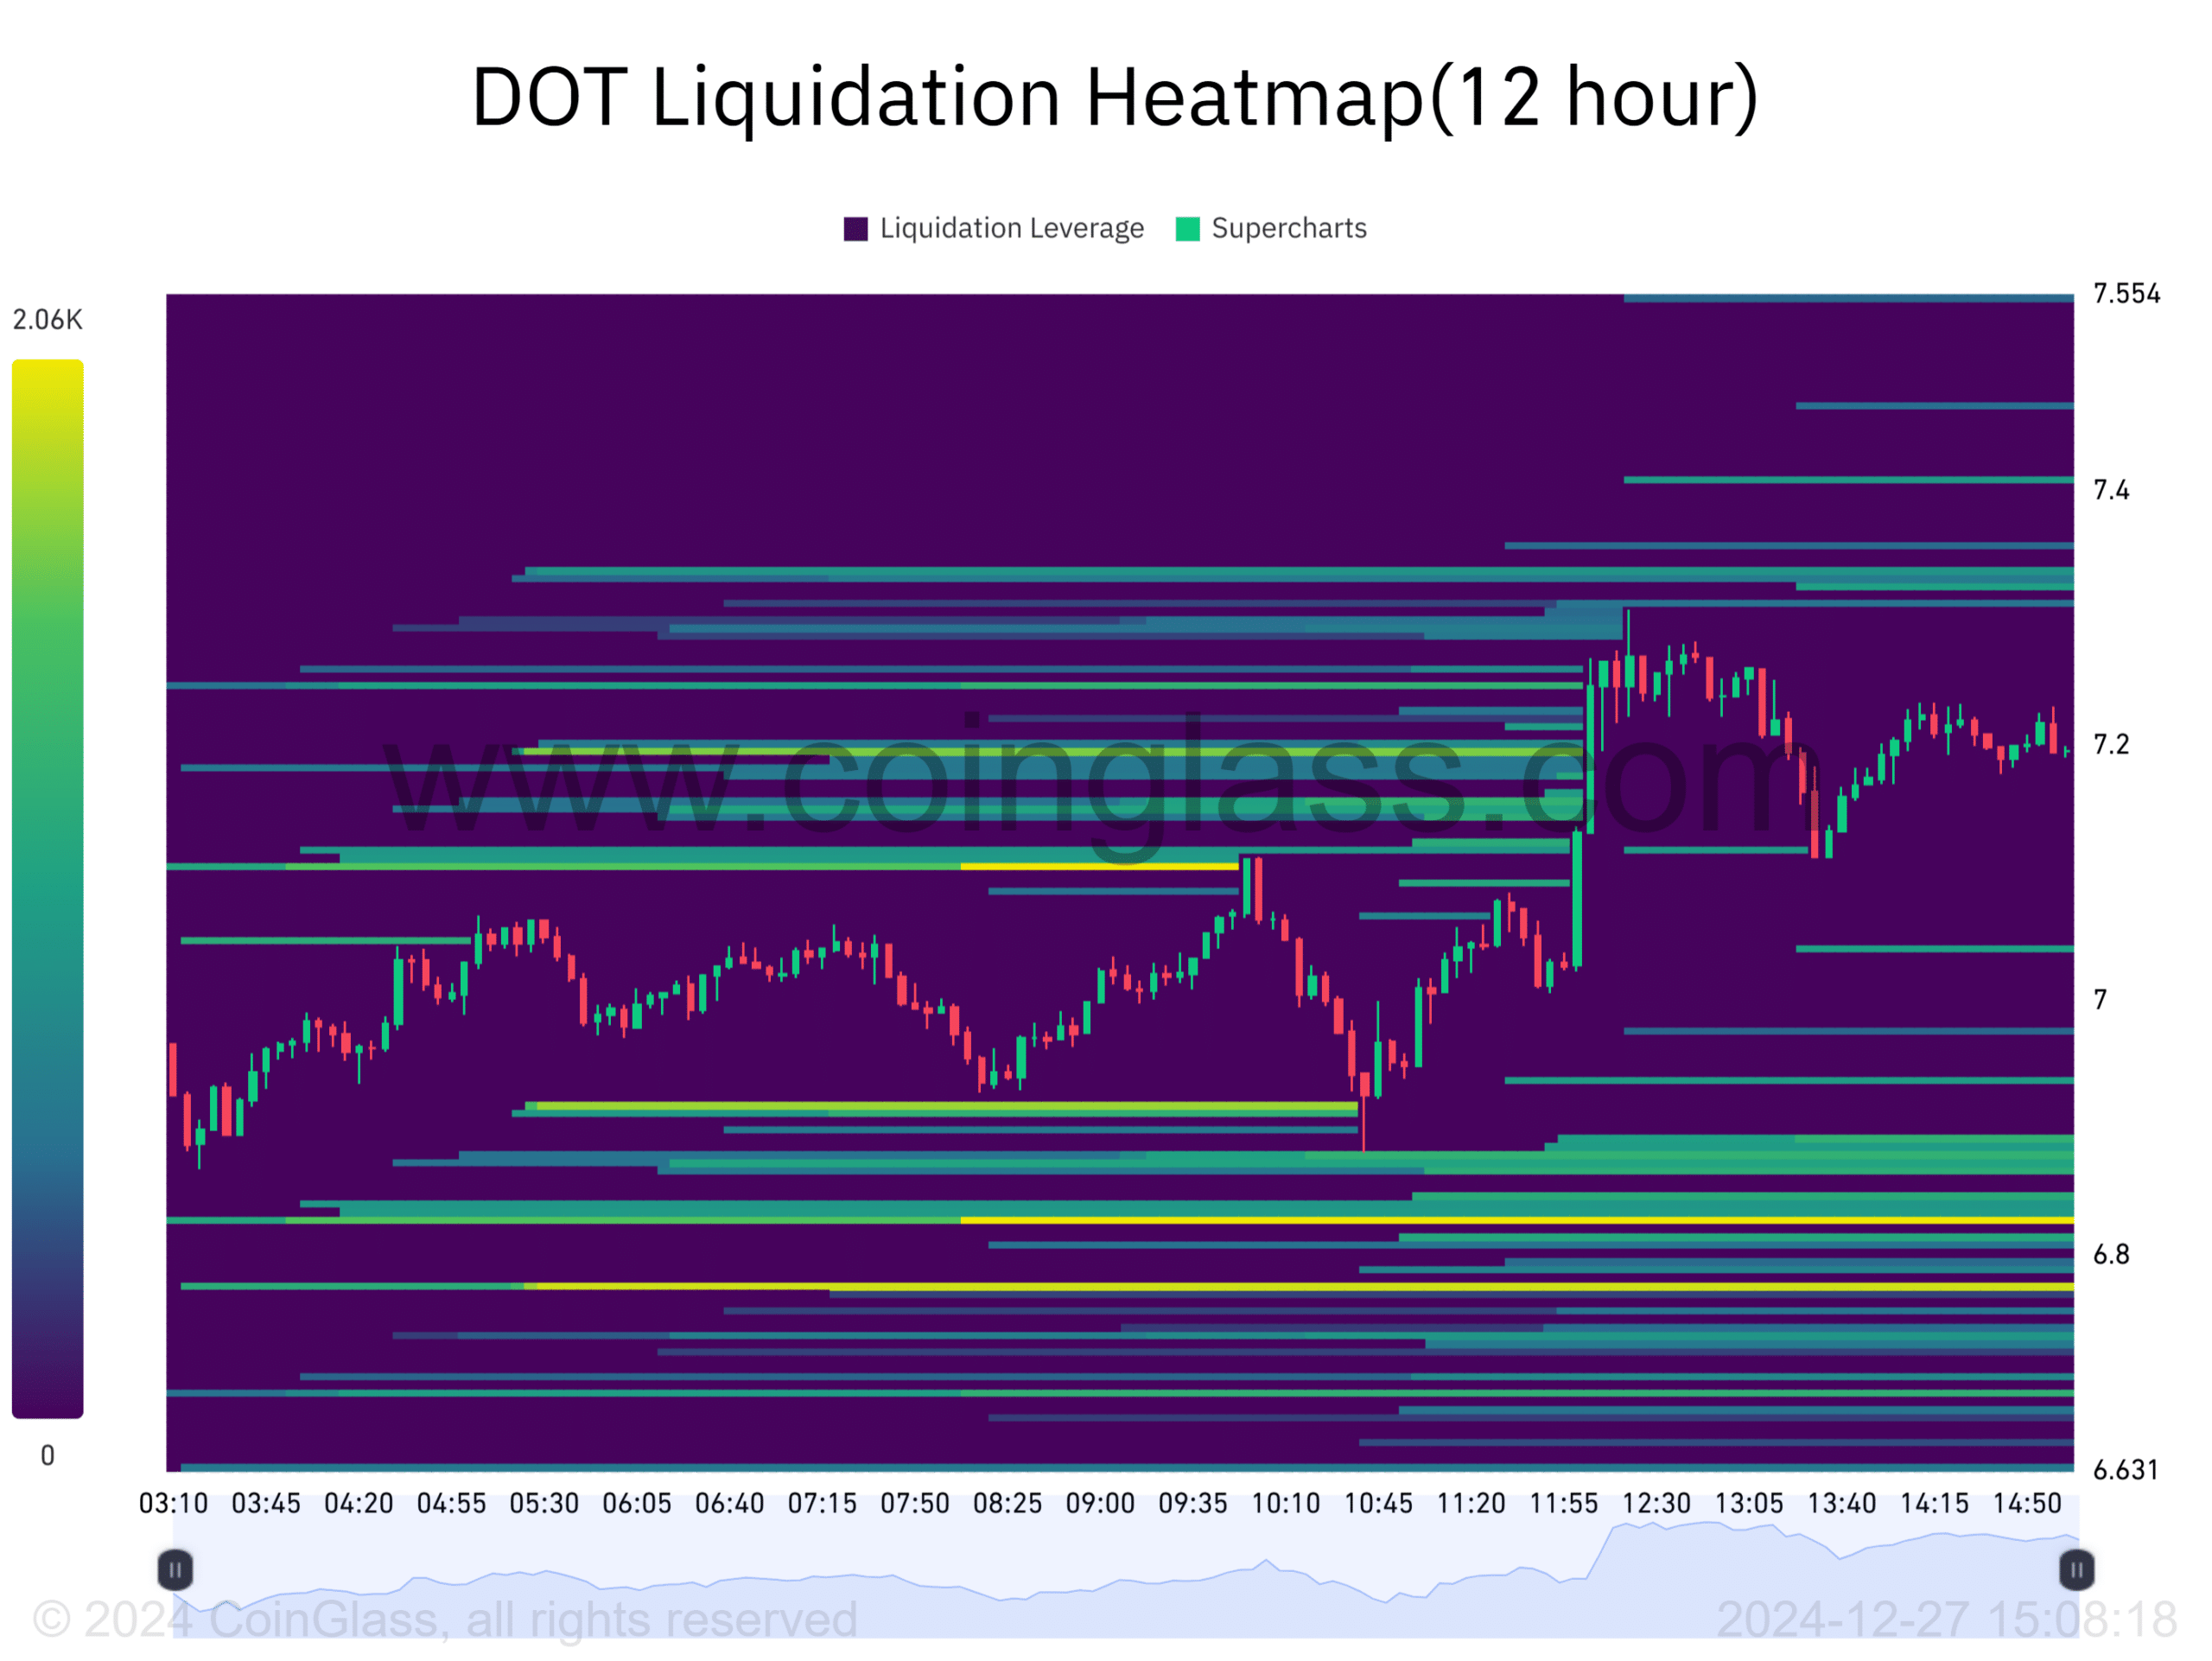
(Source: Coinglass)
Nonetheless, there is a hot liquidation zone at $6.80, which means that if the price falls to this level, it could cause a cascade of long liquidations that could push the price even lower.