

- The number of active addresses on the Near protocol has seen a significant decline, raising concerns.
- NEAR has now entered a critical supply zone and is likely to fall further as a “death cross” takes shape.
After a week-long rally that yielded a 17.12% gain, Near Protocol’s (NEAR) bullish momentum has begun to fade. The price of the asset has gradually declined, with a negligible rise of just 0.18% over the past 24 hours.
Given current market sentiment, NEAR appears poised to reverse its recent minimal gains as declining interest in the asset reflects a shift toward bearish conditions.
A potential price drop to come?
There has been a sharp drop in the number of active addresses on Near Protocol, showing a lack of interest, which often negatively impacts the price.
The number of active addresses increased from 4.2 million on January 1 to 3.2 million at press time, according to Artemis.
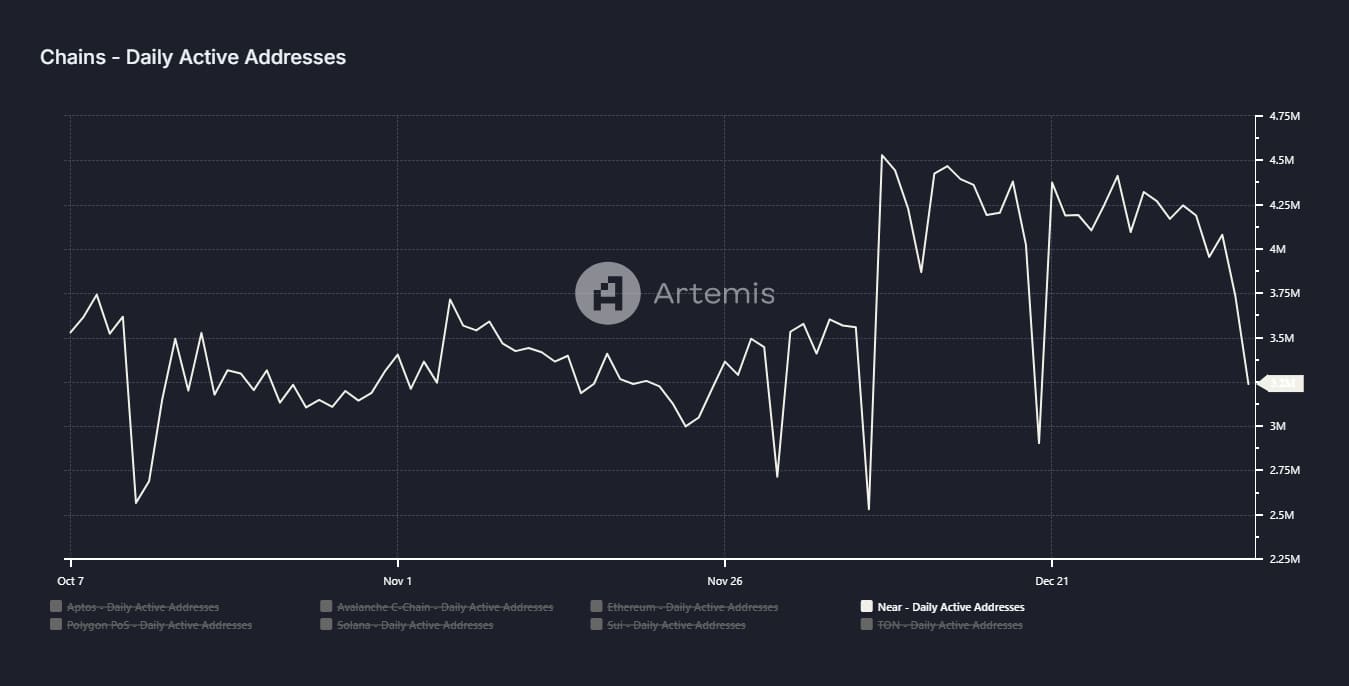
Source: Artemis
This drop suggests that fewer market participants are transacting the token or engaging with the protocol, which could push NEAR prices down even further.
To assess whether this trend correlates with price movements, AMBCrypto looked at the price action on the charts and found signs of a potential decline.
Supply zone puts downward pressure on NEAR
On the 4-hour chart, NEAR appeared to be in a vulnerable position after trading in a supply zone between $6.154 and $6.311.
A supply zone is an area where large sell orders are concentrated, which typically causes the asset to decline when the price reaches that level.
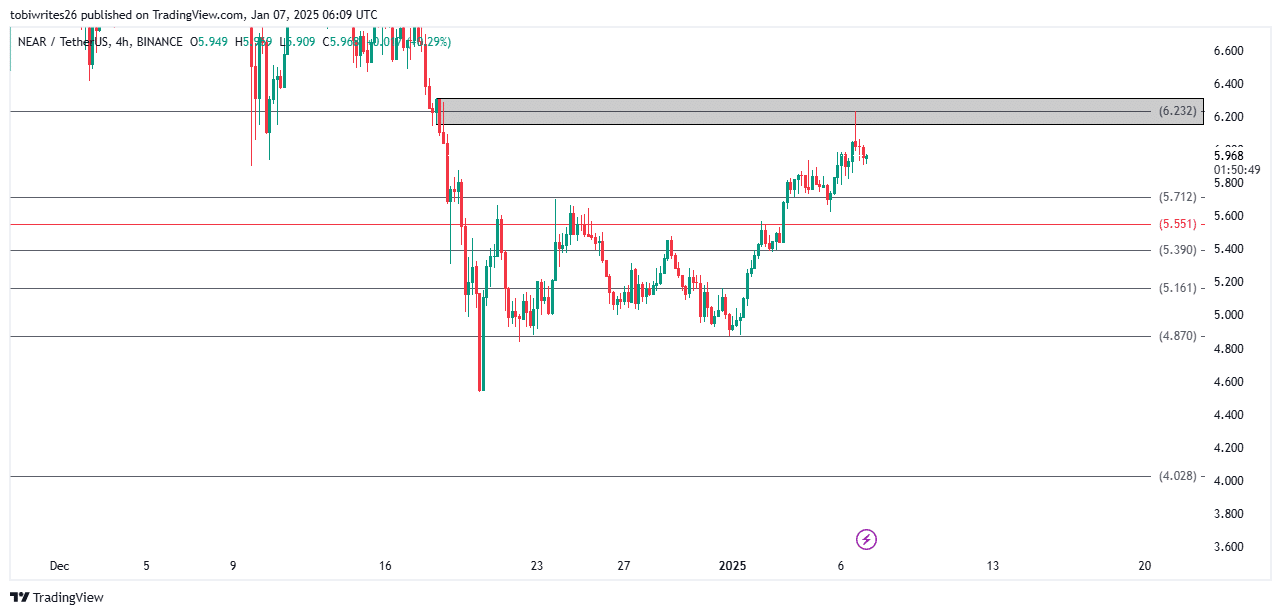
Source: TradingView
Using the Fibonacci retracement tool, this suggests that the asset could see a price decline, potentially reaching $4.870 if selling pressure intensifies.
However, there are other key support levels that the price can bounce off as shown on the chart, including at $5.712, $5.551, $5.390, and $5.161.
Further Analysis of Technical Indicators Suggests Bearish Outlook for NEAR Holders
Downward trend confirmed
The average directional index (ADX) on the chart indicated strong bearish sentiment, as the ADX line climbed higher, reading 42.19 at the time of writing.
The ADX is a technical indicator used to assess the strength of a market trend. An upward movement in the ADX suggests a strong trend, while a downward movement indicates a weak trend.
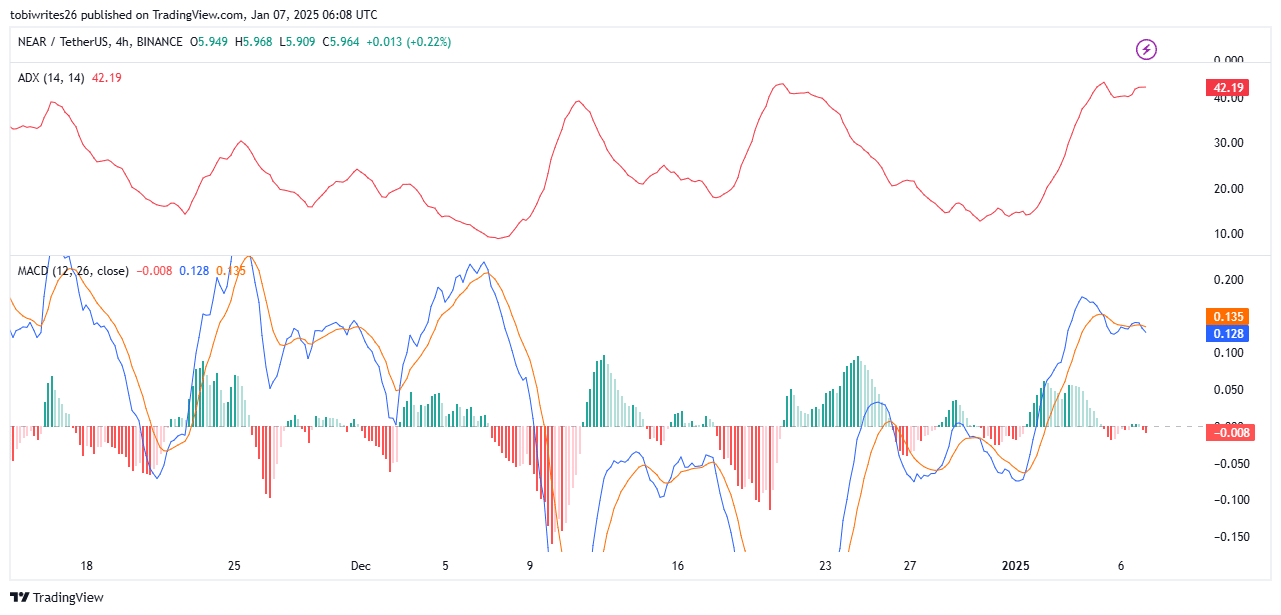
Source: TradingView
The formation of the death cross – a pattern where the signal line (orange) crosses above the blue MACD line – further confirms this bearish signal. Currently, the orange line sits at 0.135, while the blue line sits at 0.128.
Read NEAR Protocol (NEAR) Price Forecast 2025-2026
The death cross is usually followed by a price decline and the formation of red histogram bars, as shown in the chart.
If the ADX line continues its upward trend and the signal line remains above the MACD line, the price of the asset is likely to continue falling.