

- Ethereum Selling Pressure Dominated Binance
- ETH is down 18.61% over the past month.
Since hitting a recent high of $3,746 a week ago, Ethereum (ETH) experienced strong downward pressure.
During this period, ETH fell to a local low of $3,157. Although the altcoin has made moderate gains, it continues to decline.
At the time of writing, Ethereum was trading at $3,196, down 2.17% on the daily charts. ETH also fell by 12.67% on the weekly charts and 18.61% on the monthly charts.
This decline on the ETH charts is largely attributed to increased selling pressure, according to CryptoQuant.
Ethereum Selling Pressure Dominates
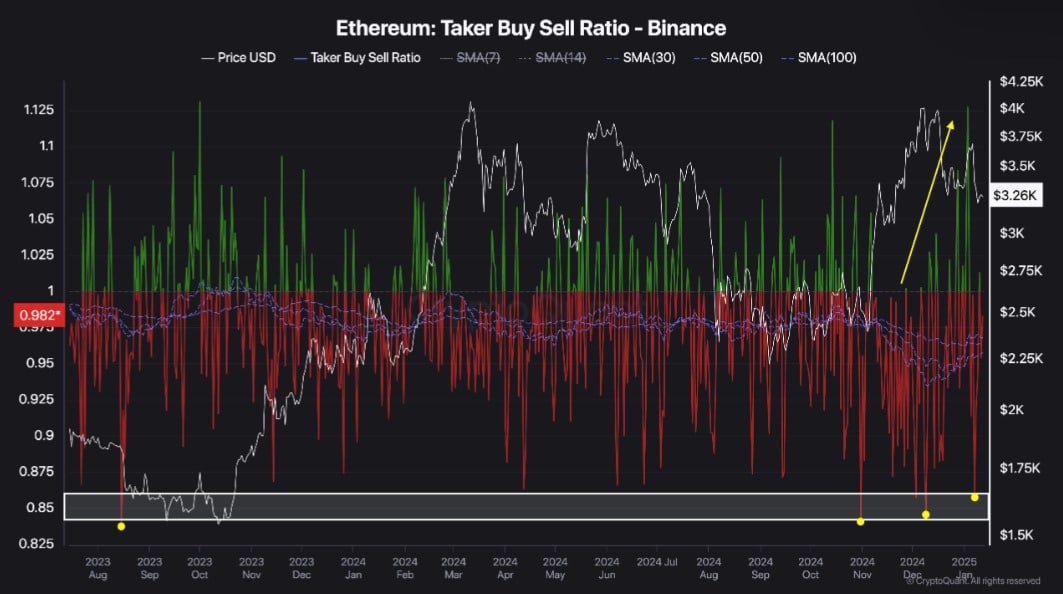
According to CryptoQuant analysis, ETH is under heavy selling pressure on Binance. Thus, since November 2024, Ethereum has experienced considerable selling pressure on the exchange.
Source: CryptoQuant
The growing dominant selling pressure on Binance is evidenced by the ETH taker’s buy/sell ratio. This metric has remained negative since November 2024, indicating a higher volume of sell orders than buy orders.
During this period, the buy/sell taker ratio fell to levels not seen since August 2023, reflecting the prevailing bearish sentiment.
As buyers attempted to take control in December, sellers quickly took over, reinforcing the bearish momentum.
The sustained selling pressure over the past few months highlights a market that is both bearish and cautious.
On the other hand, a rising put ratio presents a potential buying opportunity for long-term holders.
Impact on ETH price charts?
As observed above, Ethereum is under heavy selling pressure, which has negatively affected the altcoin’s price movements.
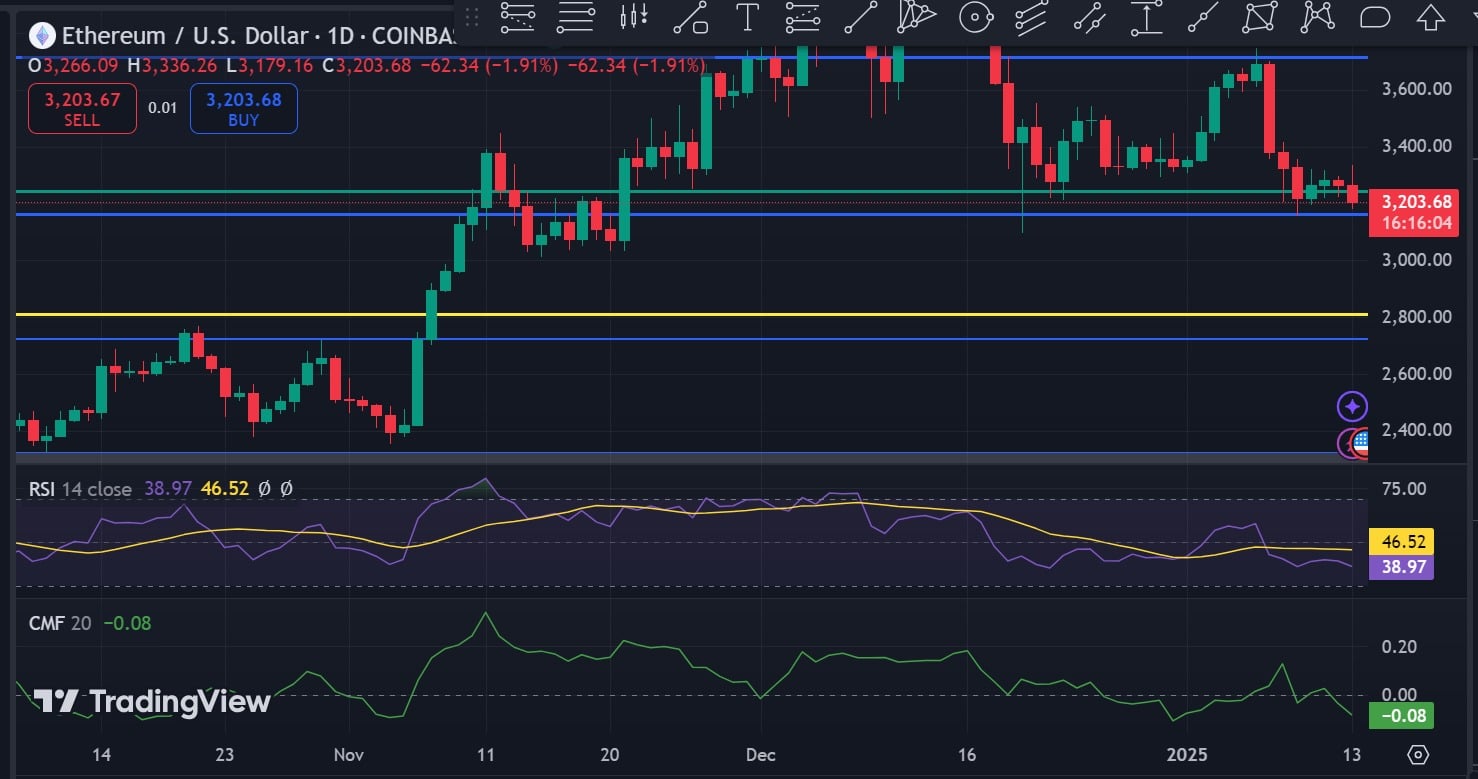
Source: Tradingview
To start, we can see higher selling pressure as ETH Chaikin (CMF) money flow has turned negative. With a CMF located at -0.08, this implies that sellers dominate the market.
This market behavior is confirmed by the decline in the Relative Strength Index (RSI) which has fallen into almost oversold territory to settle at 38. Such a decline implies that sellers are in control of the market.
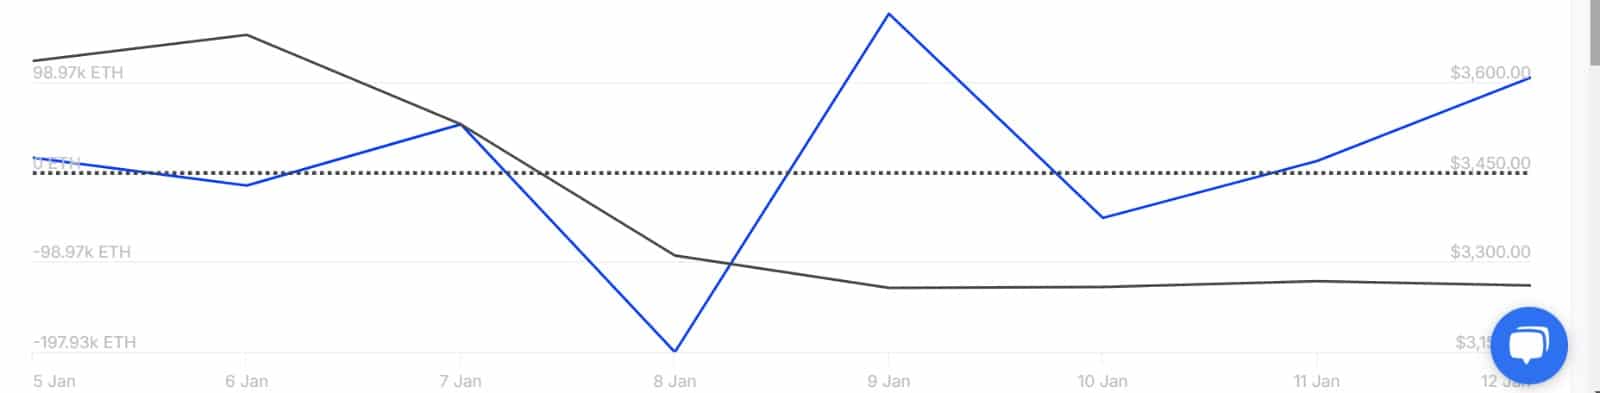
Source: In the block
Looking further, the inflow of Ethereum into exchanges has increased over the past week. This increased from -50.77k to 103.77k, indicating that there are more ETH inflows onto exchanges than outflows.
Usually, higher inflows on exchanges precede increased selling pressure, as investors tend to sell when making these transfers.
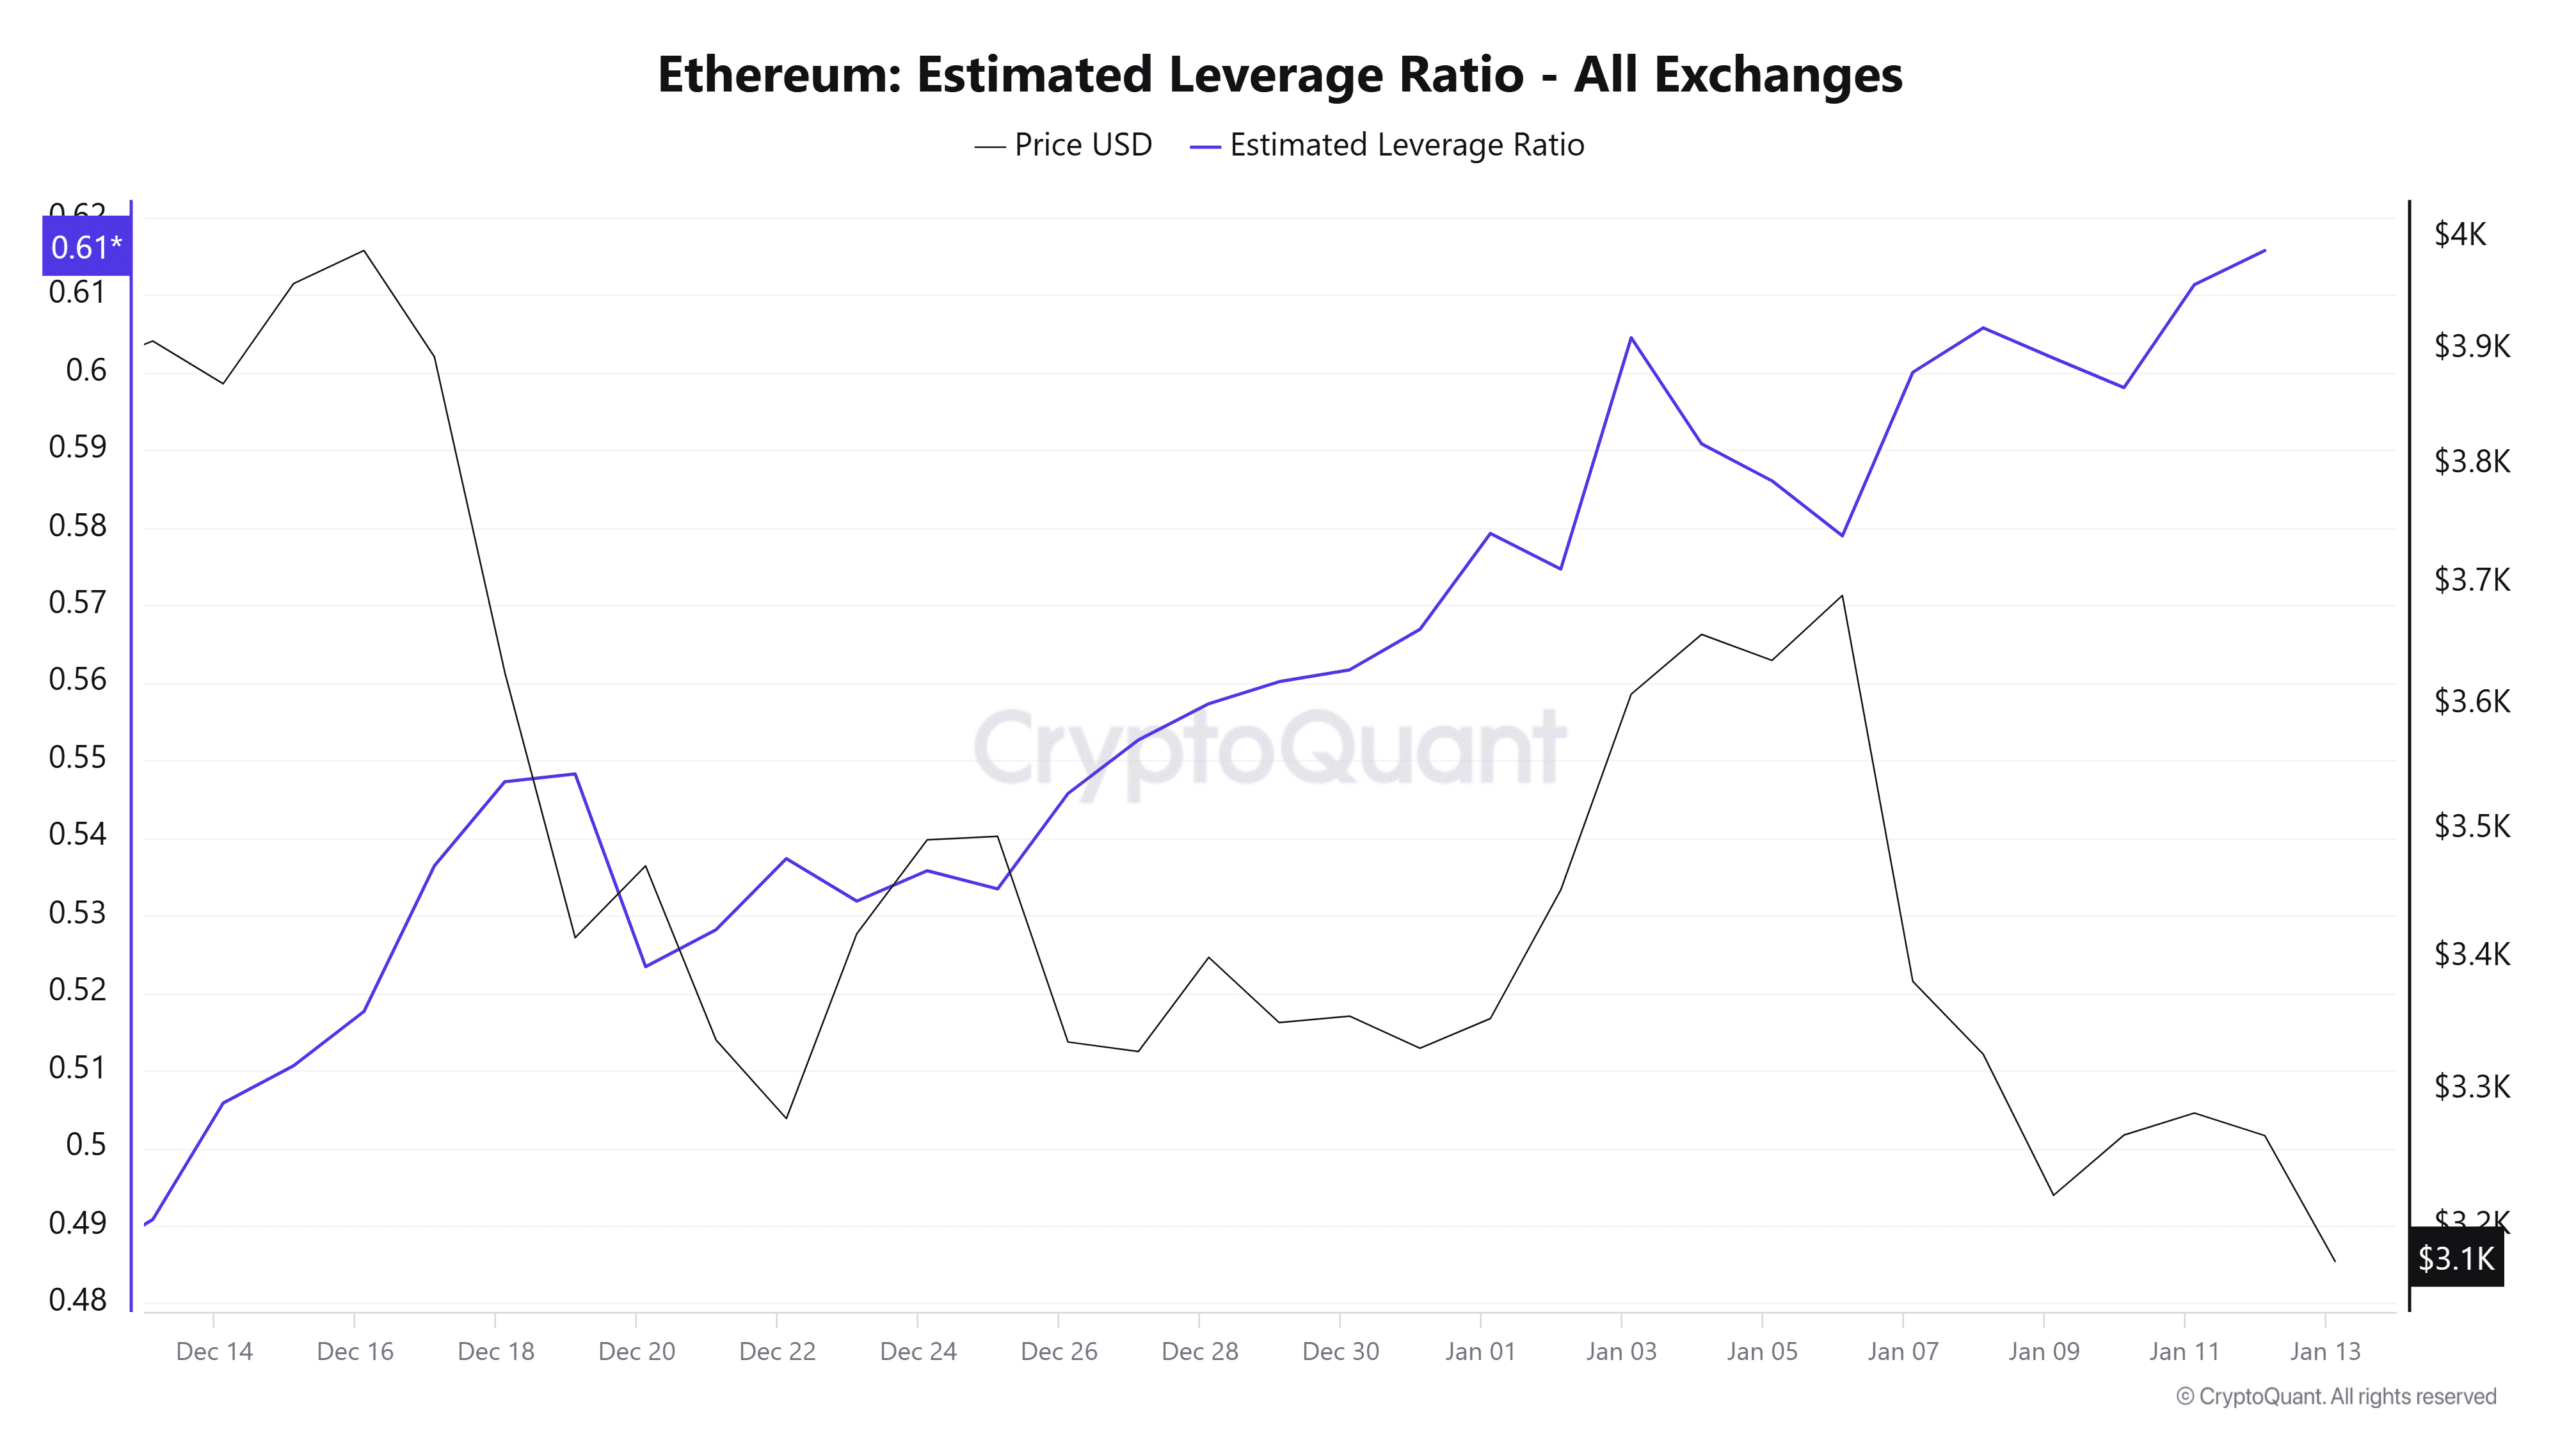
Source: CryptoQuant
Ethereum’s estimated leverage ratio (ELR) has seen a sustained increase over the past month. When the ELR rises during a downtrend, it indicates bearish sentiment, increasing the risk of a long squeeze.
If prices continue to decline, long positions could be liquidated, leading to a long squeeze and further price declines.
Read Ethereum (ETH) Price Forecast 2025-2026
In conclusion, Ethereum is under heavy selling pressure as bearish sentiments persist. If current market conditions continue, ETH could decline to $3,030 and potentially drop below $3,000 to find support around $2,810.
However, if the downtrend exhausts and a reversal occurs, the altcoin could reclaim $3,300.