

- Whale accumulation spurred bullishness on SHIB charts
- A gap below the range followed by a rapid recovery gave a high probability buy signal
Shiba Inu (SHIB) has suffered losses alongside the rest of the memecoin sector since late November. Bitcoin’s (BTC) struggle to reclaim $100,000 and the accompanying price volatility haven’t helped SHIB bulls at all.
However, the underlying pessimistic sentiment did not deter a whale from withdrawing 8.18 trillion SHIB from the Crypto.com exchange. These tokens were then valued at approximately $195.1 million.
A SHIB buying opportunity near the lows of the range
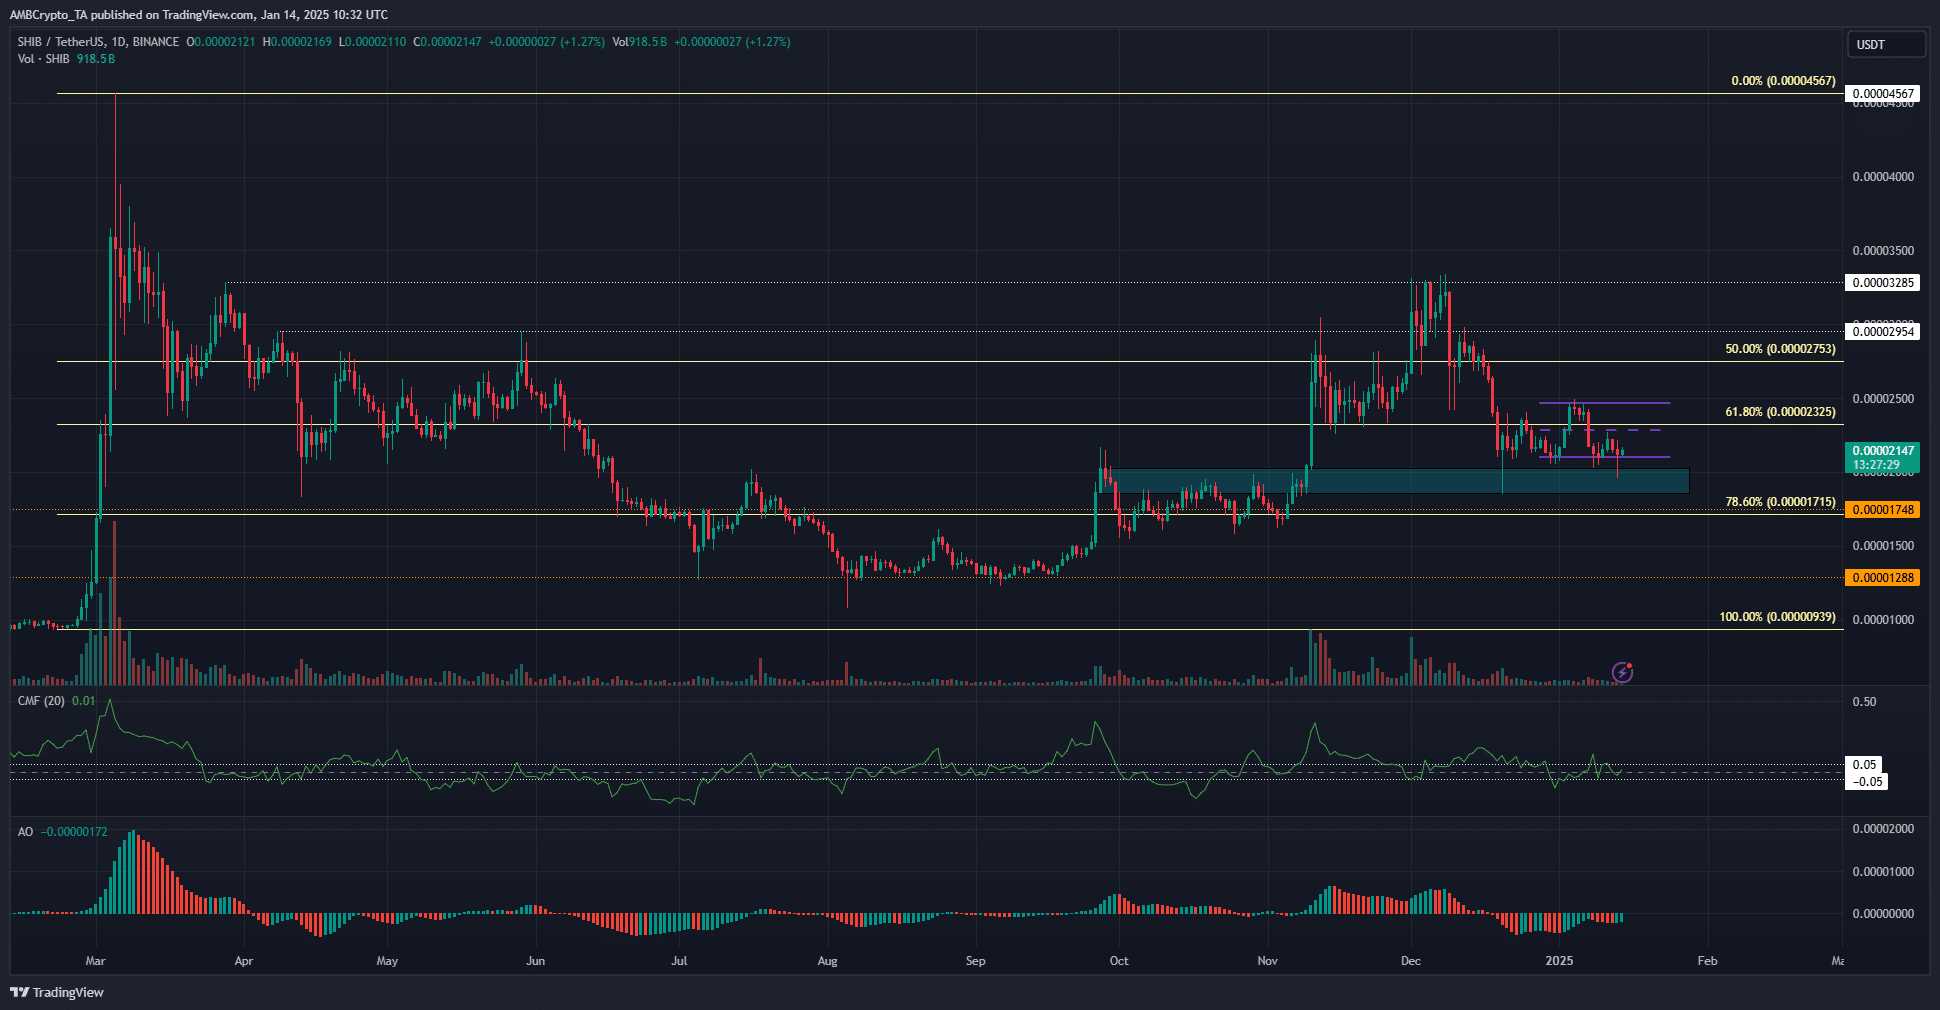
Source: SHIB/USDT on TradingView
The daily chart revealed that Shiba Inu was on a slow recovery path after the deep correction of mid-2024. The $0.00002 area, which was resistance before November, remained a support area at press time.
And yet, the daily time structure was bearish after the December slump took the price back below the 61.8% retracement level at $0.00002325. Since then, the same level has opposed bullish breakout efforts, leading to the formation of a short-term range.
Capital inflows were neutral and momentum was slightly bearish on the daily chart, according to the Awesome Oscillator.
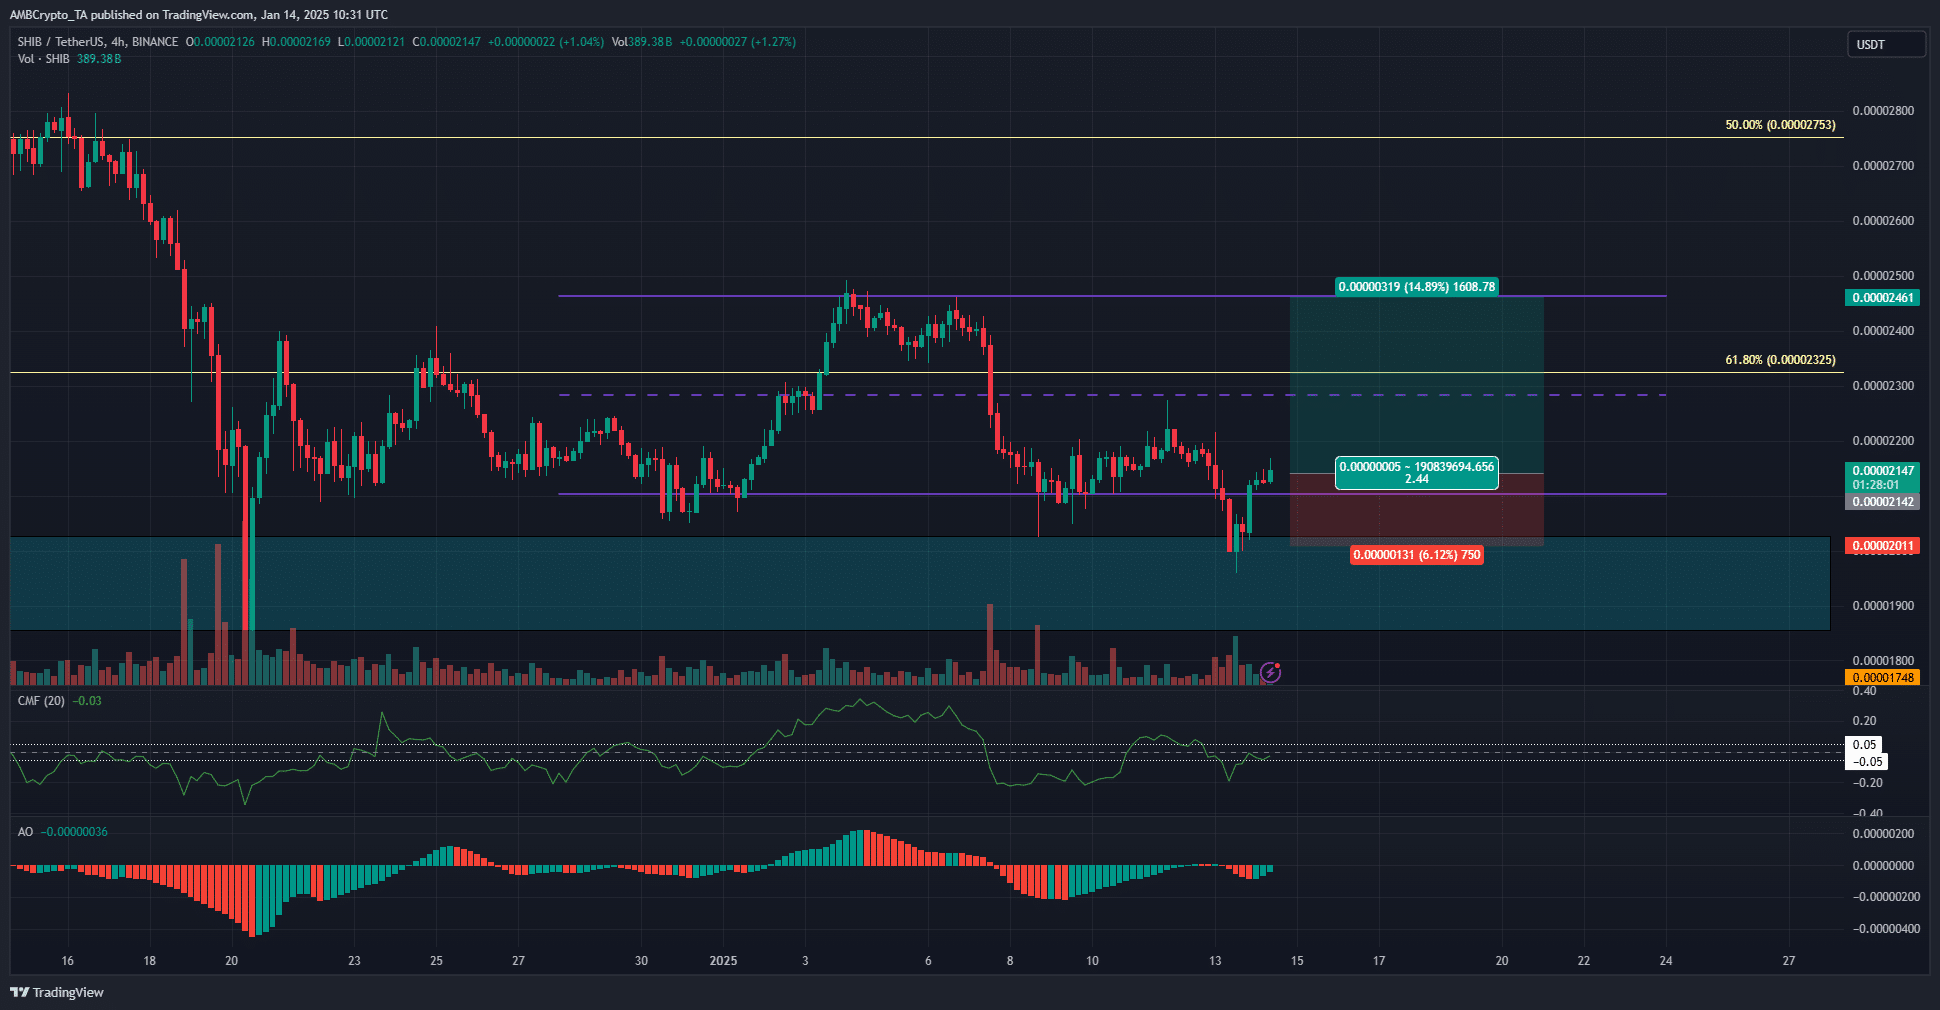
Source: SHIB/USDT on TradingView
The formation of the short-term range was clearer on the 4-hour chart. The range low at $0.000021 momentarily failed on Monday as BTC slipped to $89.2k. Since then, Shiba Inu has made a rapid recovery. This gap below the lows of the range and the rapid recovery was a strong buy signal.
Read Shiba Inu (SHIB) Price Prediction 2025-26
This means that there could be a high chance of bullish prices reaching the highs of the $0.0000246 range over the next week. However, traders should be careful. The CMF showed that capital flows were slightly negative. Without buying pressure, SHIB may struggle to break above the average resistance at $0.0000228.
Traders can set their stop-loss below local lows, or at $0.0000202, as the fair value gap over a shorter time frame, around $0.0000208, can be expected to stops any downward movement.
Disclaimer: The information presented does not constitute financial, investment, business or other advice and represents the opinion of the author only.