

- TON’s 7-day and 30-day realized volatility reached all-time lows, marking a rare calm.
- Historically, low volatility in crypto markets often precedes sharp price movements in either direction.
Calm periods are rare in the crypto market and often portend seismic shifts on the horizon. Toncoin (TON) is having one of those moments.
Recent data reveals that the blockchain project’s 7- and 30-day annualized realized volatility has plunged to all-time lows, signaling a phase of relative calm.
For seasoned traders, this could be more than just a statistical anomaly. Historically, prolonged periods of low volatility in cryptocurrency markets have acted as precursors to sharp price movements, either up or down.
As TON enters this critical phase, all eyes are on whether the current lull will turn into a breakout or breakdown.
What is annualized realized volatility?
Annualized realized volatility measures the actual historical fluctuations in the price of an asset over a specific period, expressed on an annualized basis.
This metric is essential in crypto markets because it highlights periods of stability or turbulence, providing traders with insight into potential market behavior.
A phase of low volatility often indicates a market in equilibrium, but this equilibrium rarely lasts long in highly speculative markets.

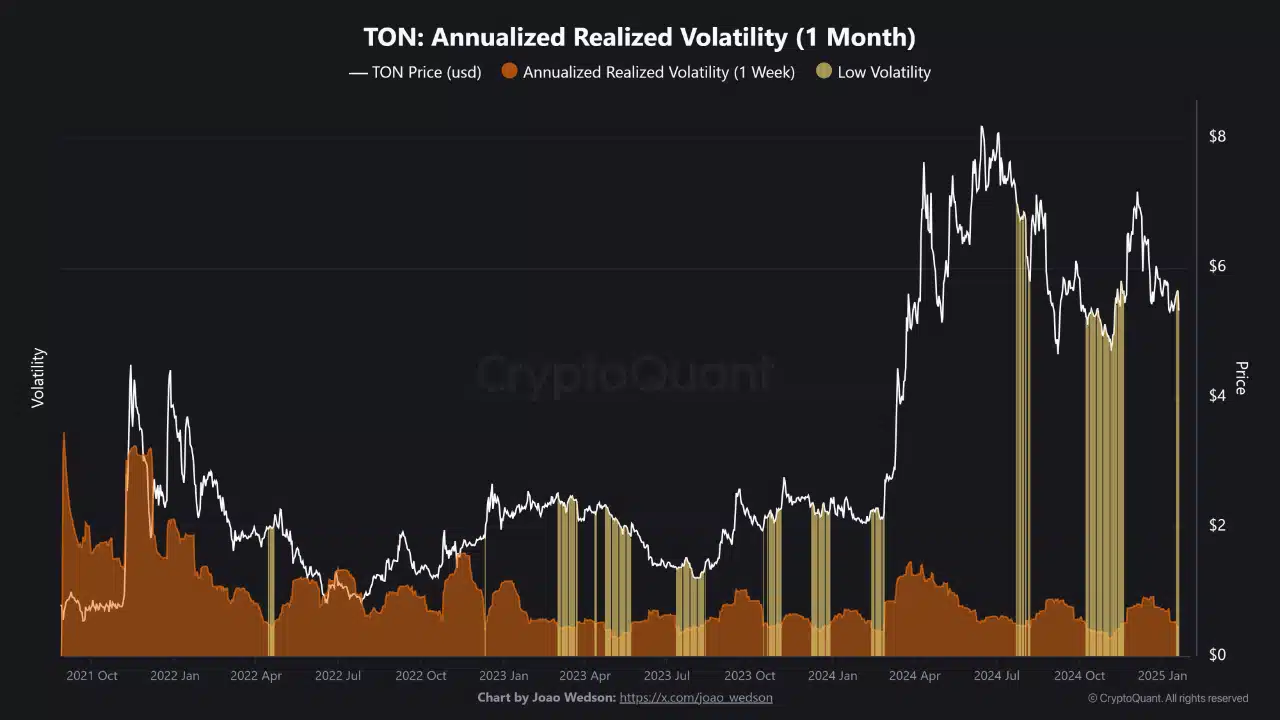
Source: CryptoQuant
TON’s 7-day annualized realized volatility shows greater short-term responsiveness to market movements, while the 30-day metric captures longer-term trends.
Currently, both indicators are at all-time lows, signaling unprecedented calm in TON’s price movements. This calm could precede significant market action, making it a critical indicator to watch.
Source: CryptoQuant
Low volatility: a precursor to market movements
Low volatility generally signals reduced trading activity or reduced investor interest, often reflecting a consolidating market.
For TON, the current all-time lows suggest equilibrium, with neither buyers nor sellers generating strong price momentum. This dormant phase, however, has historically served as the calm before the storm in crypto markets.
Looking at the history of TON, periods of low volatility have often preceded sharp price changes. By mid-2022, after a prolonged phase of low volatility, TON’s price rose from $1.30 to over $2.00 in a matter of weeks, a 50% increase.
Similarly, in early 2023, low volatility led to a breakout that saw prices rise from $2.50 to nearly $4.50, marking an 80% rise.
Broader crypto trends are reinforcing this trend. For example, Bitcoin’s extensive consolidation around $6,000 in 2018 led to a sharp decline below $4,000. Ethereum showed similar behavior in mid-2020 before the DeFi bull run began.
Read Toncoin (TON) Price Prediction 2025-26
What could happen to TON?
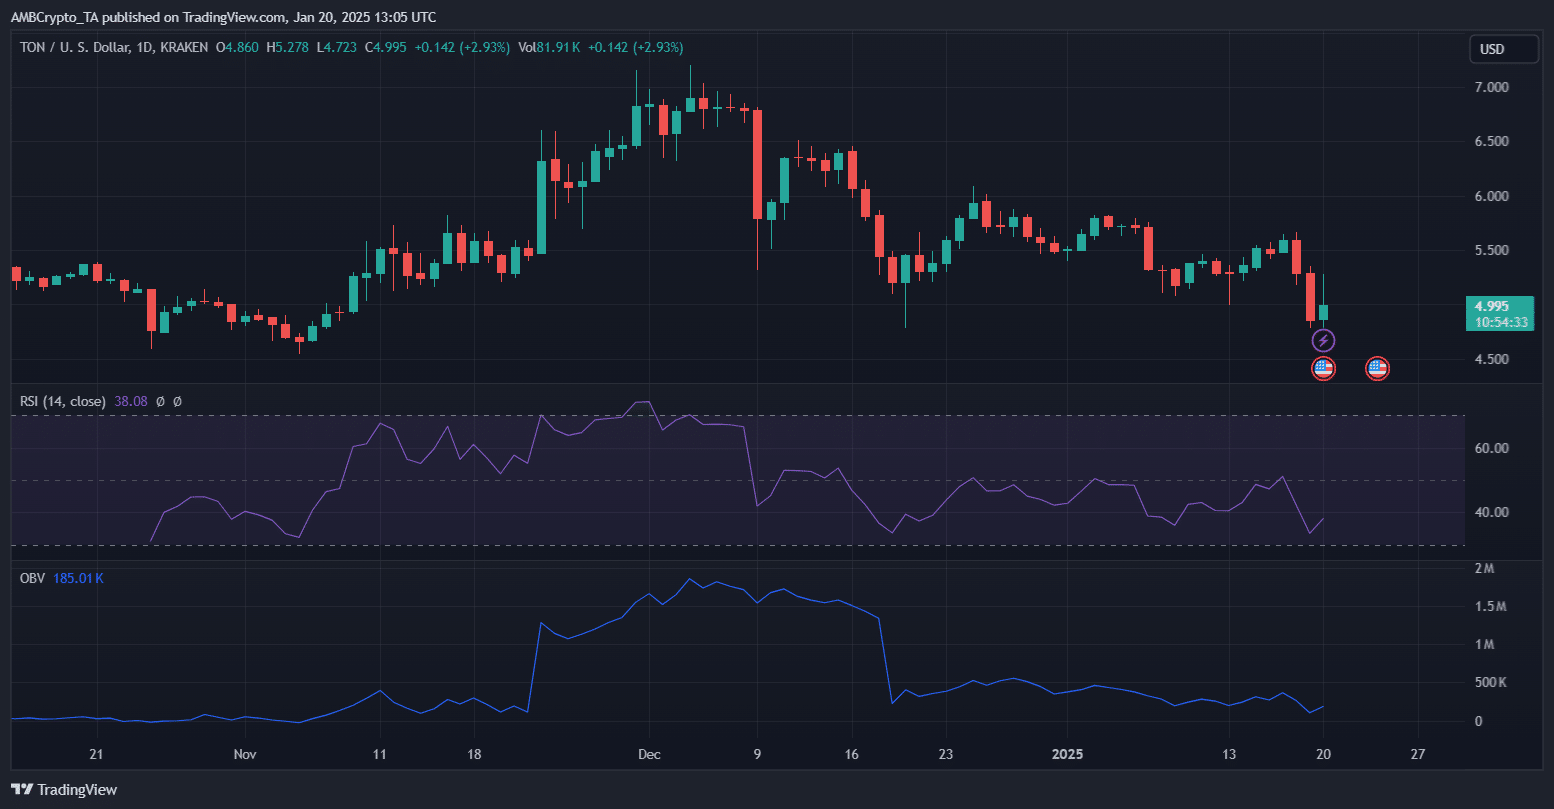
Source: TradingView
TON’s low volatility portends a critical moment. The RSI indicates slight bearish momentum, but no oversold conditions yet. This suggests that sellers are dominating, but exhaustion may be near.
Meanwhile, the OBV reflects a decline in volume, confirming reduced trading activity – a classic signal of low volatility.
Upside potential could come from a reversal in the RSI alongside renewed buying interest. A break above the $5.50 resistance could trigger bullish momentum, targeting $6.00 or higher.
Conversely, a break below the $4.70 support, combined with a consistently low OBV, could signal further declines towards $4.30.
External factors, such as market trends or ecosystem developments, will likely determine the direction of the impending breakout.