

- TON maintained the price range of $6.3.
- However, the activity of its daily active addresses was lower.
Toncoin (TON) has seen substantial growth in its blockchain infrastructure over the past few months, reaching a record number of wallet addresses. At the same time, the total value locked (TVL) on its platform has shown a notable upward trend.
However, the number of active addresses on the Toncoin network followed a more consistent and stable pattern, without significant fluctuations.
Toncoin records an increase in addresses
Data from IntoTheBlock indicated a remarkable increase in the number of Toncoin wallet addresses. The data showed that the number increased from around 3.6 million in January to over 39.5 million at the time of publication.
This growth signifies a significant expansion of activity on the channel during the year.
AMBCrypto’s analysis of DeFiLlama’s Toncoin’s total value locked (TVL) corroborated this trend of increasing engagement on the blockchain. The data showed that TVL has increased sharply from around $14 million in January to over $596 million at the time of publication.
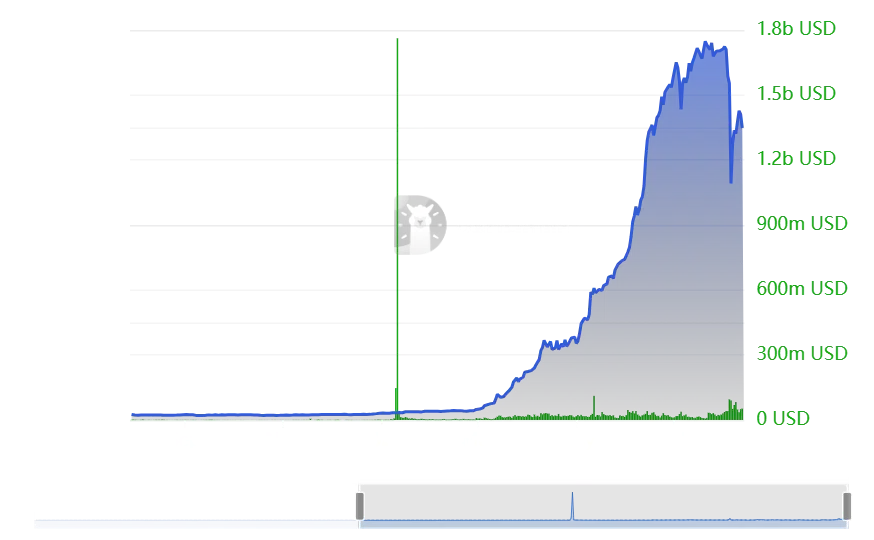
Source: DefiLlama
It is important to note, however, a recent slowdown, with TVL peaking at over $750 million on July 29 before falling back to current levels.
Toncoin records fewer spikes in token addresses
AMBCrypto’s analysis of Toncoin’s daily active addresses revealed a modest but consistent trend over the past few months. This trend, however, does not quite match the explosive growth seen across the network as a whole.
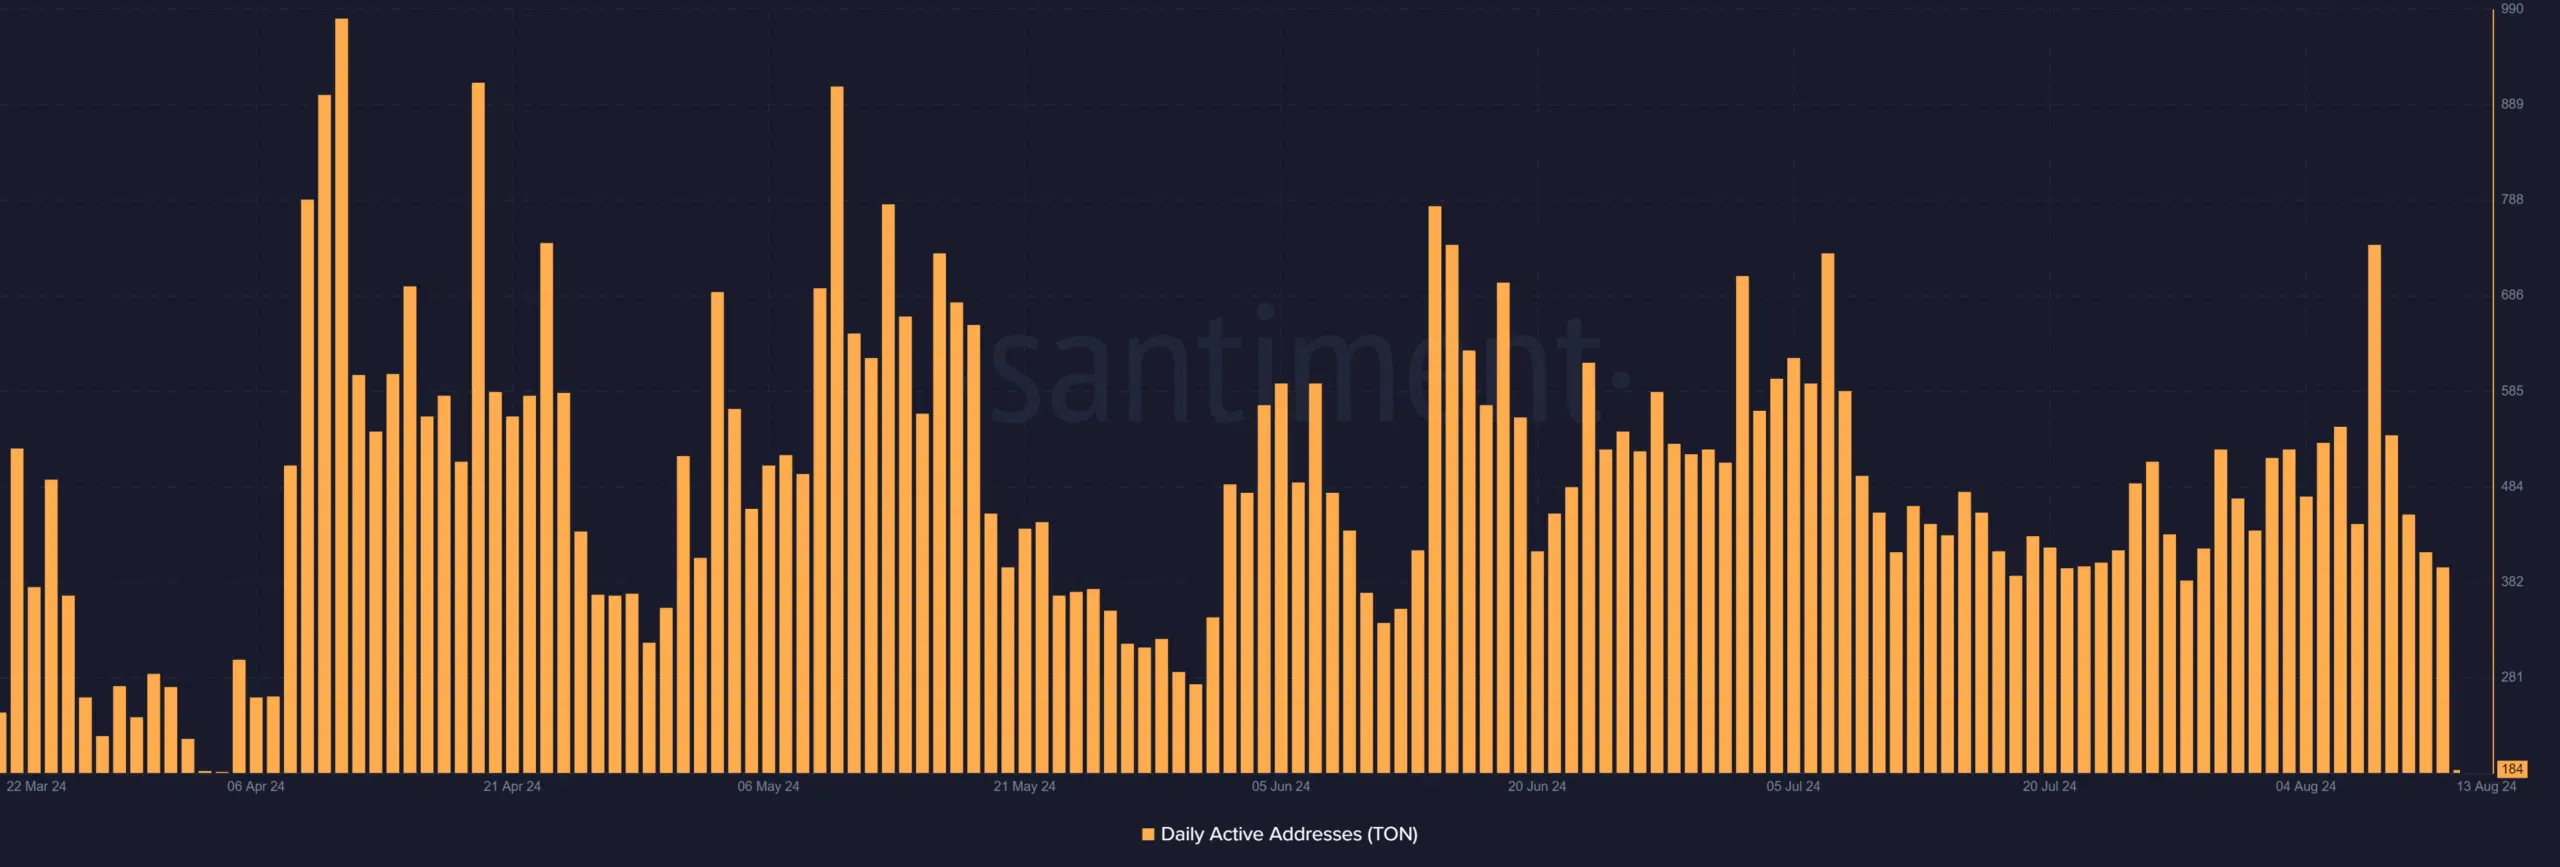
Source: Santiment
The peak number of daily active addresses over the past four months was 981 in April. At press time, that figure was 400.
The highest activity recorded this month was approximately 741 active addresses, indicating significant variation in daily engagement on the Toncoin network over time.
TON sees less enthusiasm
Toncoin’s price trend has displayed considerable volatility over the past few weeks, according to AMBCrypto’s analysis of its daily time chart.
This volatility is visually captured by the widening of its Bollinger Bands, which generally indicates increased market volatility due to large price movements both up and down.
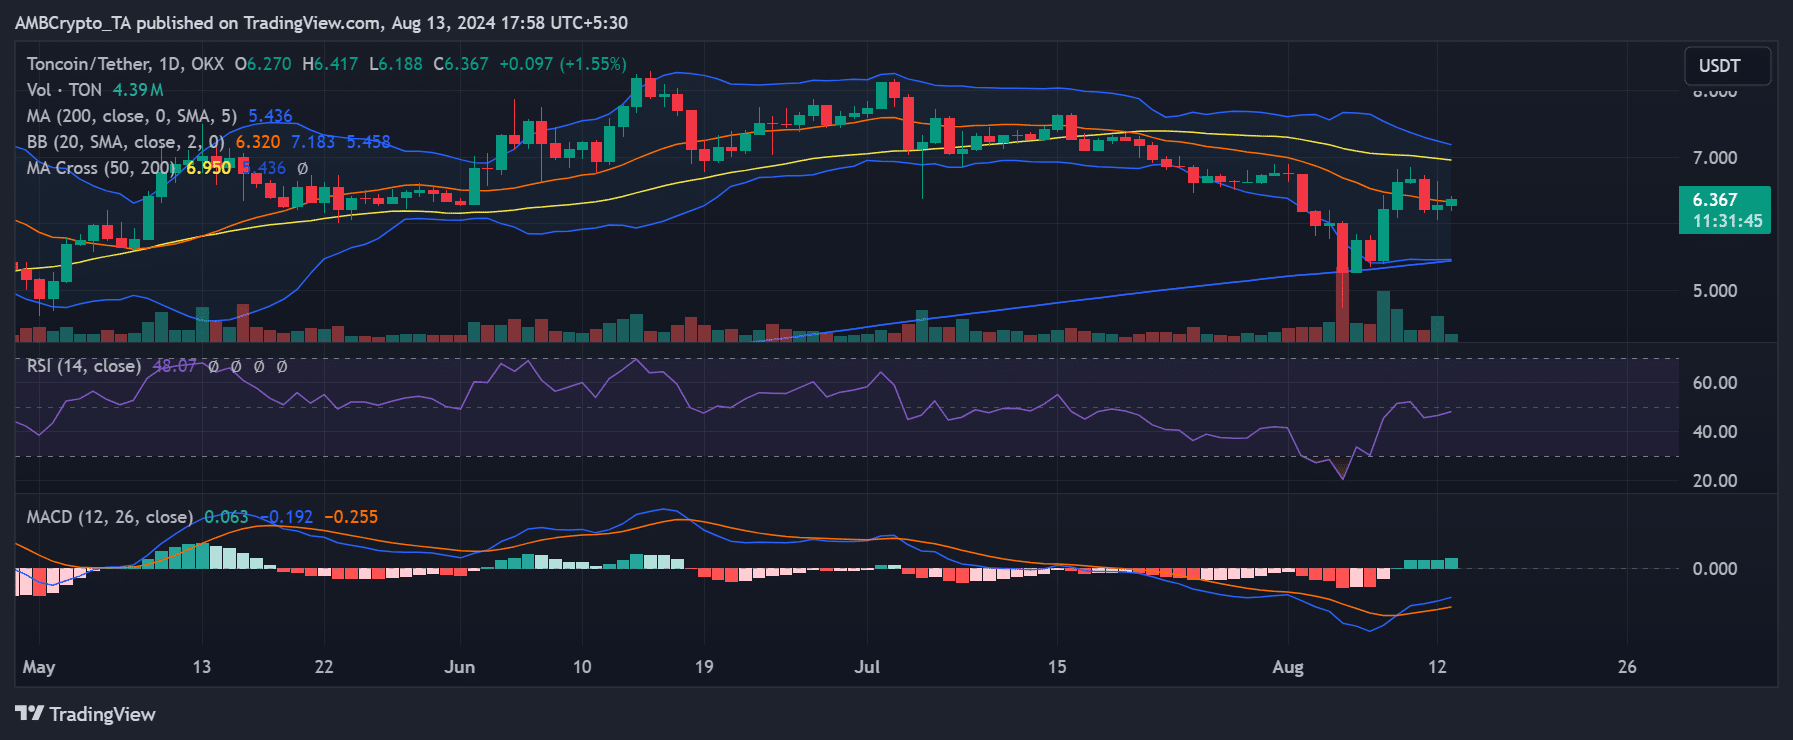
Source: TradingView
Is your portfolio green? Discover the TON Profit Calculator
At the time of writing, TON shares were trading around $6.3, up a modest 1%. This slight increase follows a less than 1% gain in the previous trading session.
However, this is still far from compensating for the drop of more than 6% recorded two sessions earlier.