

- SAND has broken out of its falling wedge, signaling potential bullish momentum
- On-chain data highlighted increasing activity and confidence in SAND’s price action.
THE Sandbox (SAND) recently broke its extended falling wedge trend, signaling what could be the start of a major uptrend. Trading at $0.2931 after climbing 12.06% at press time, SAND has recently seen an increase in market interest and trading volume.
In fact, its 24-hour trading volume also jumped 126.45% – a sign of renewed enthusiasm from traders and investors. Will this breakout be strong enough to maintain the altcoin’s momentum?
SAND Chart Analysis – What does this breakout mean?
SAND’s price chart confirmed a strong breakout above its falling wedge pattern, which had kept the token in a downtrend for months. Additionally, the Relative Strength Index (RSI) increased to 62.38 – a sign of bullish strength. The Bollinger Bands were also widening around the price candles.
Together, these indicators imply higher volatility, which often follows such breakouts. Therefore, the SAND price seemed to enter a new bullish phase. However, the token will need sustained buying pressure to confirm its long-term direction.
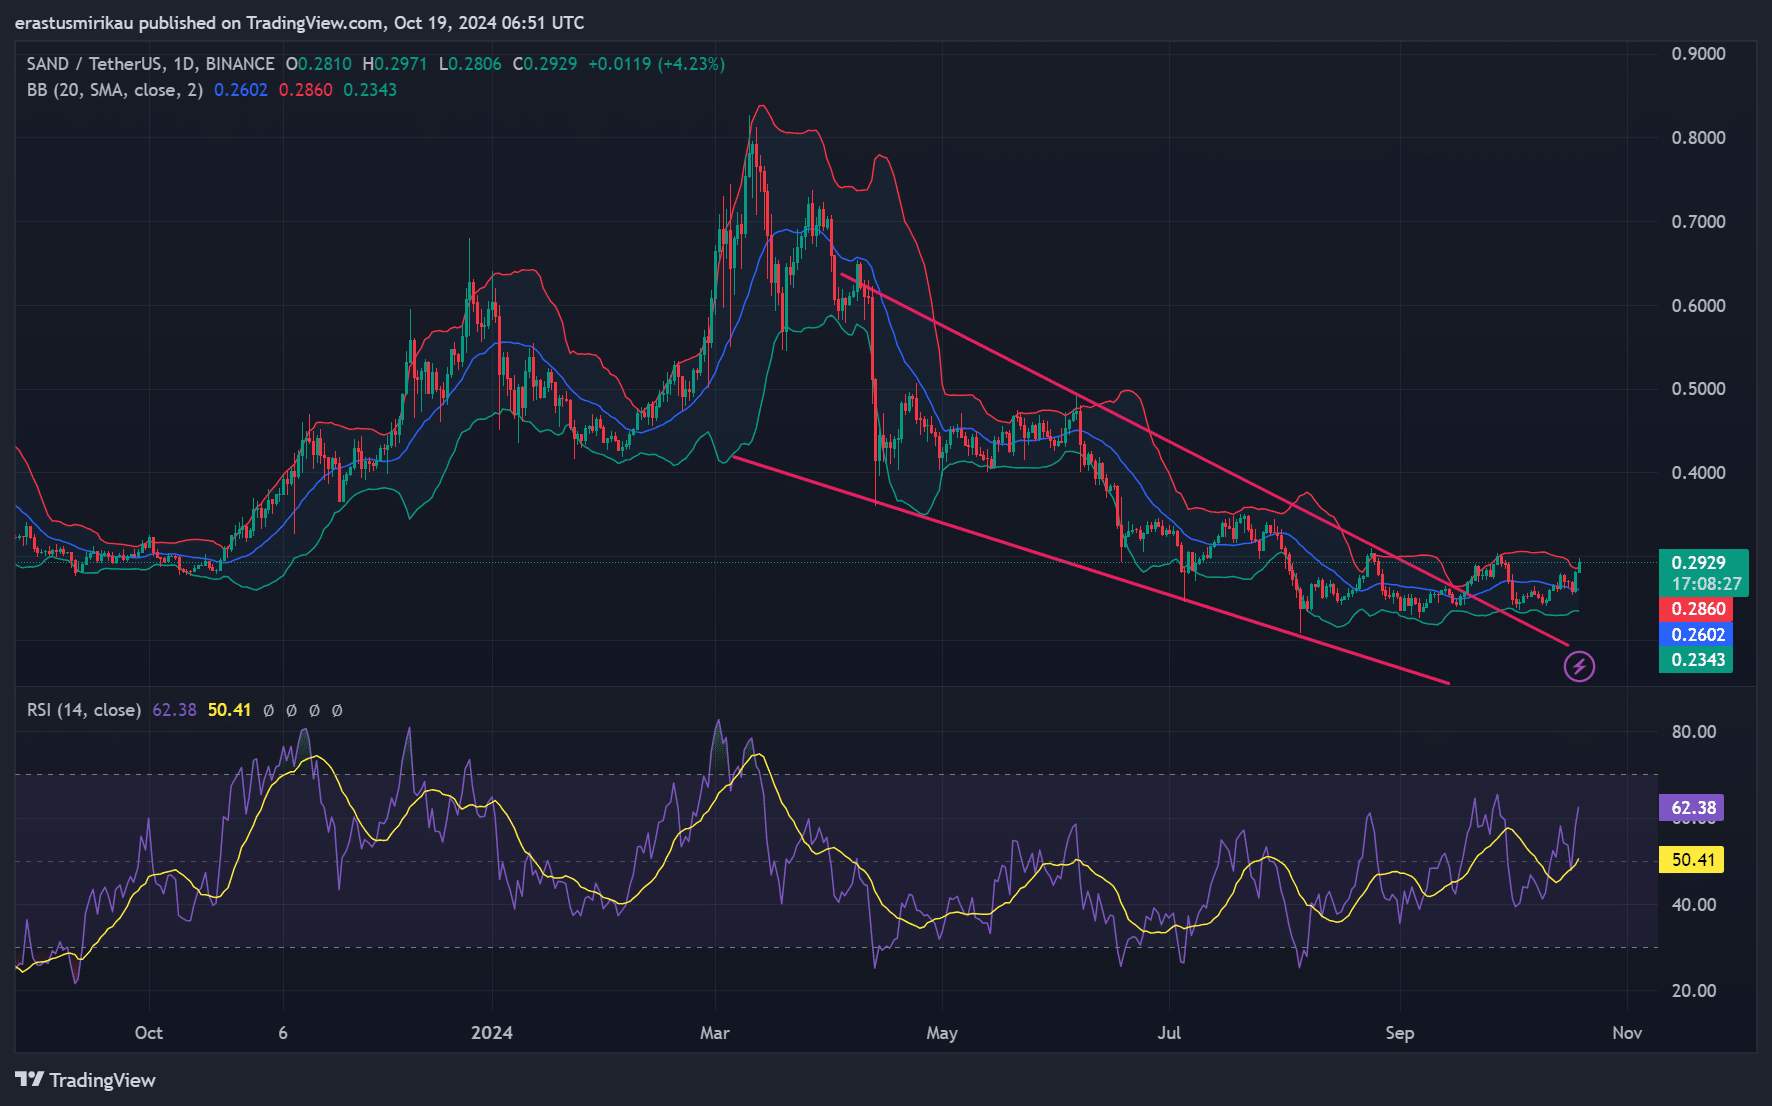
Source: TradingView
Increase in active addresses and number of transactions – Bullish support?
Additionally, CryptoQuant’s on-chain data supported SAND’s recent price surge. The number of active addresses increased by 1.54% in the last 24 hours at the time of publication, bringing the total to 40.66 thousand. This increase in network activity is crucial because it can be interpreted as signifying growing interest in the token.
Additionally, the total number of transactions increased by 2.1%, further reinforcing this trend. Simply put, the increase in user engagement suggests that SAND’s rally may not be purely speculative, but supported by strong fundamentals.
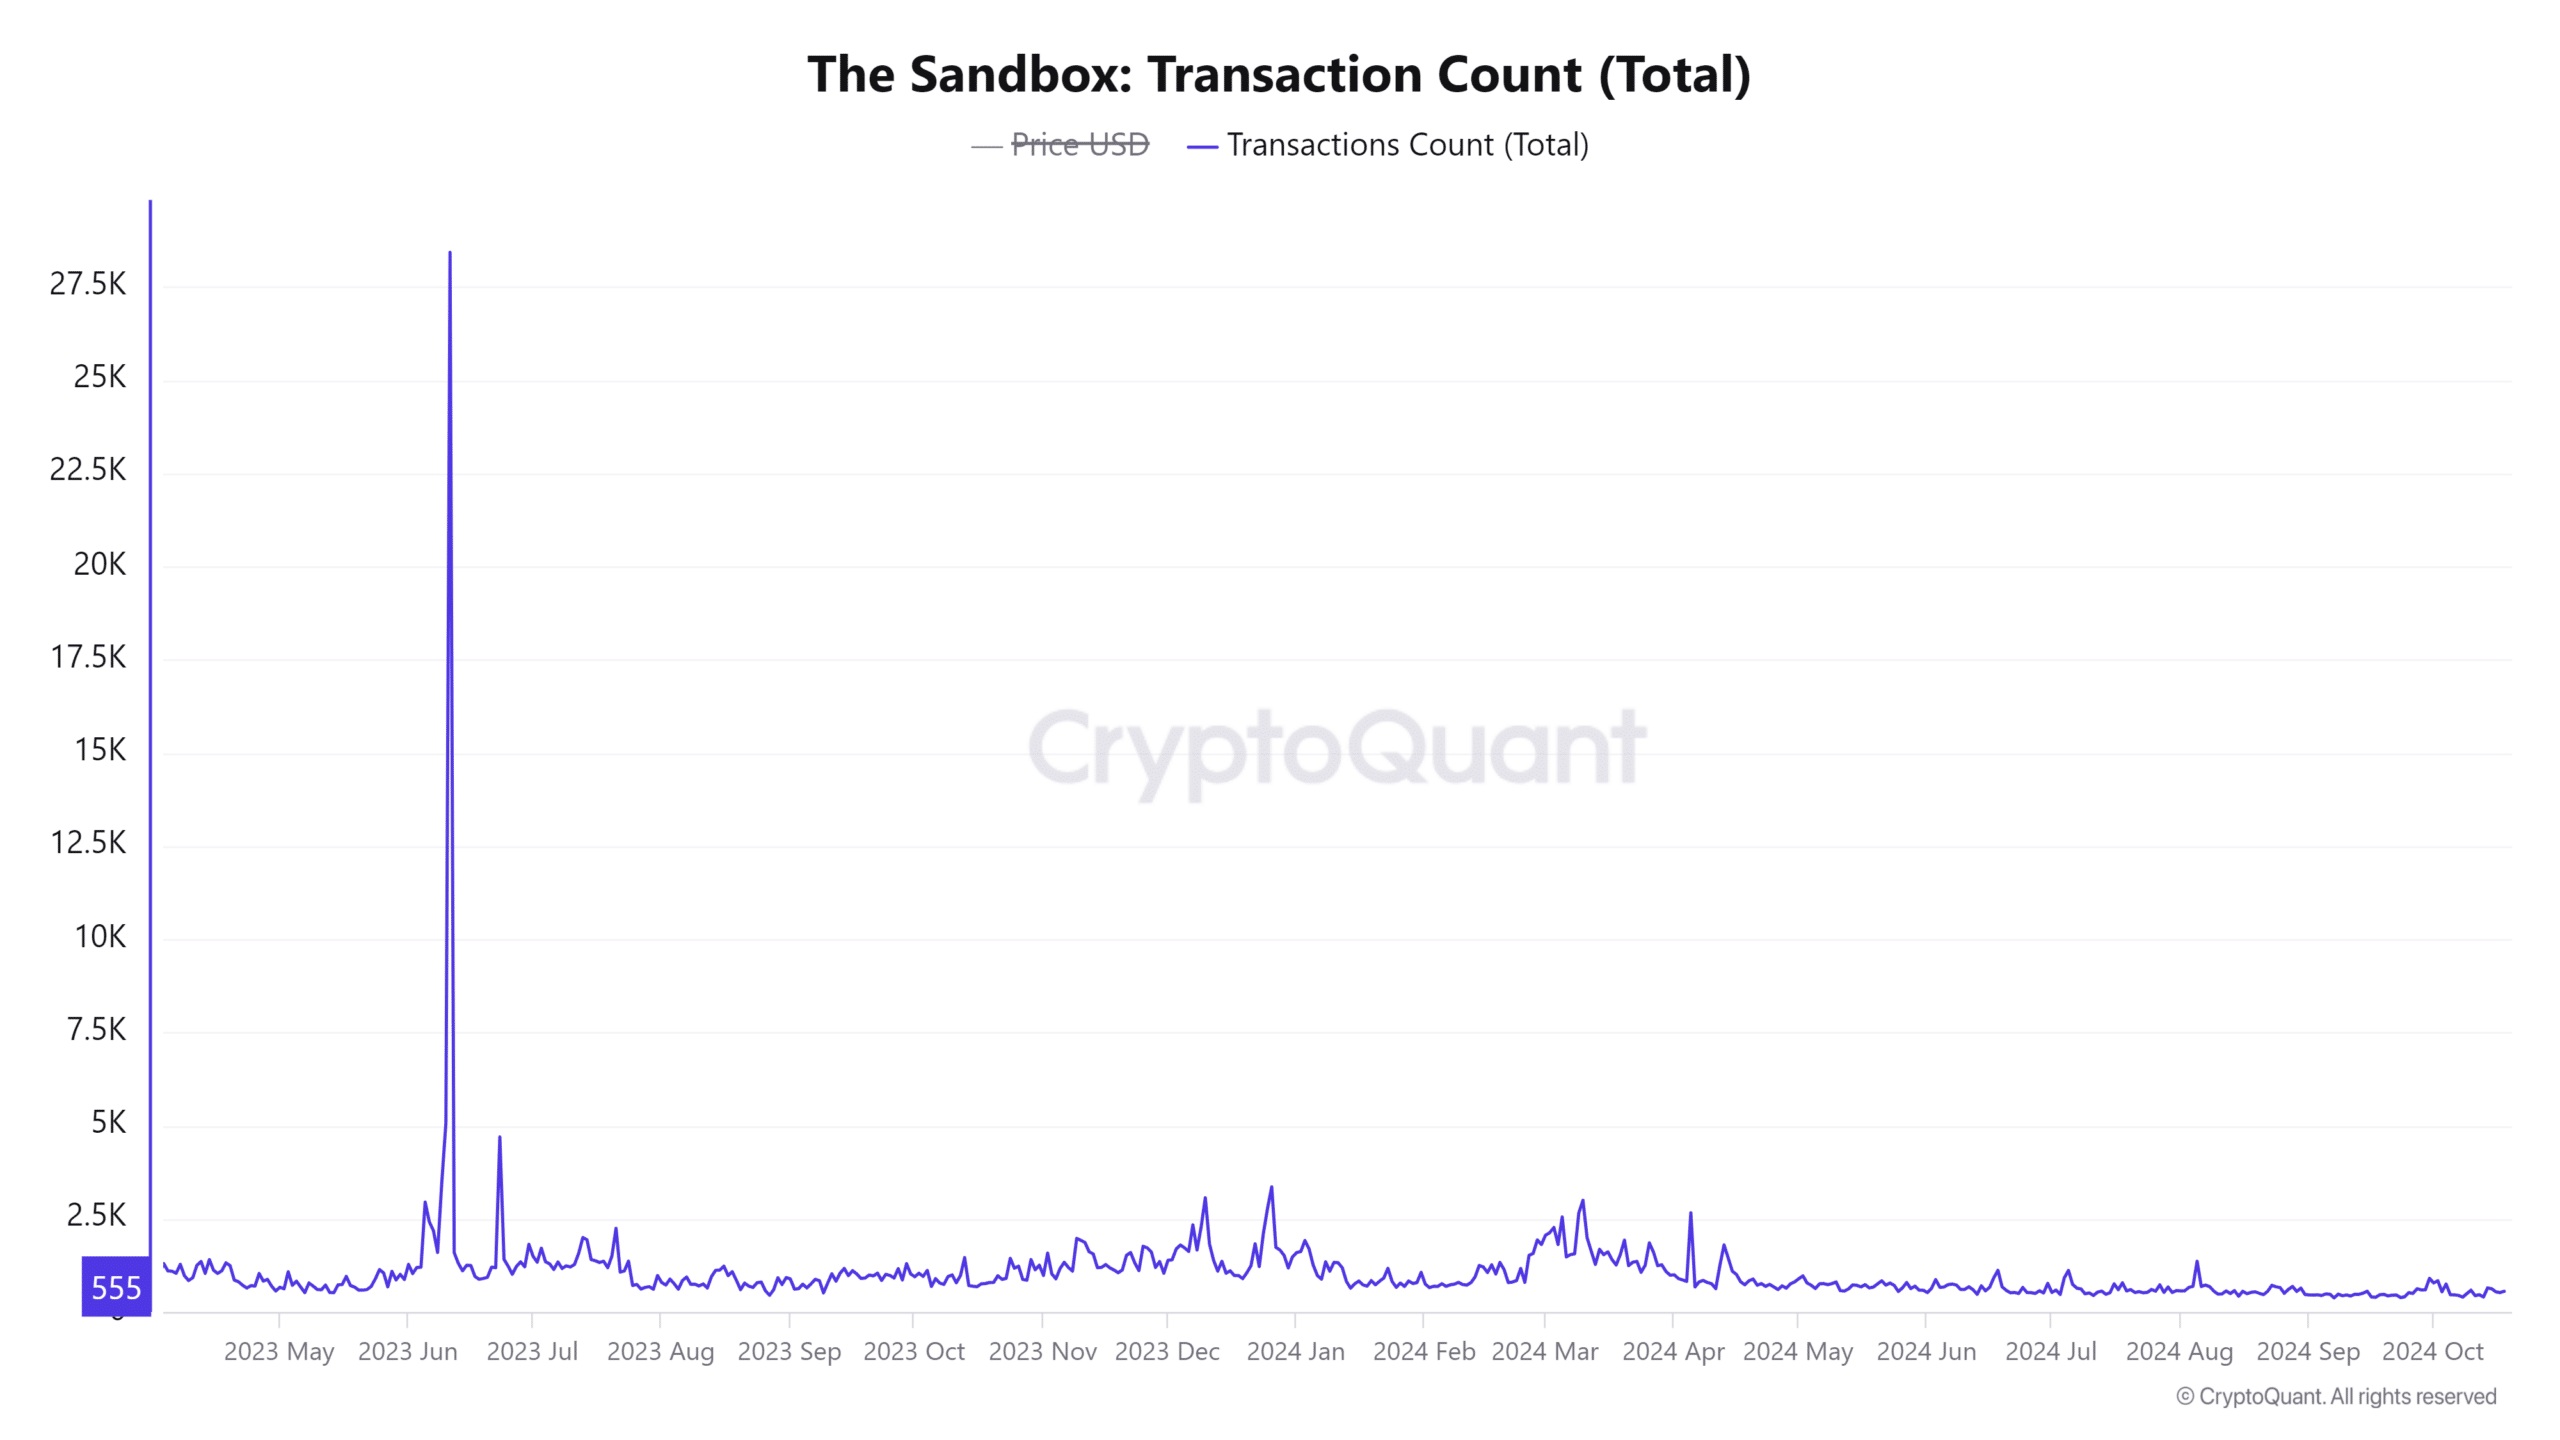
Source: CryptoQuant
Analysis of SAND foreign exchange reserves – Lower selling pressure?
Exchange reserves for SAND fell by 1.06% in the last 24 hours, indicating that fewer tokens are now available for sale on exchanges.
Therefore, this drop in available supply implied that sellers had withdrawn their tokens from exchanges, likely choosing to hold on to them. This behavior often precedes further price increases, especially since it reduces immediate selling pressure on the market.
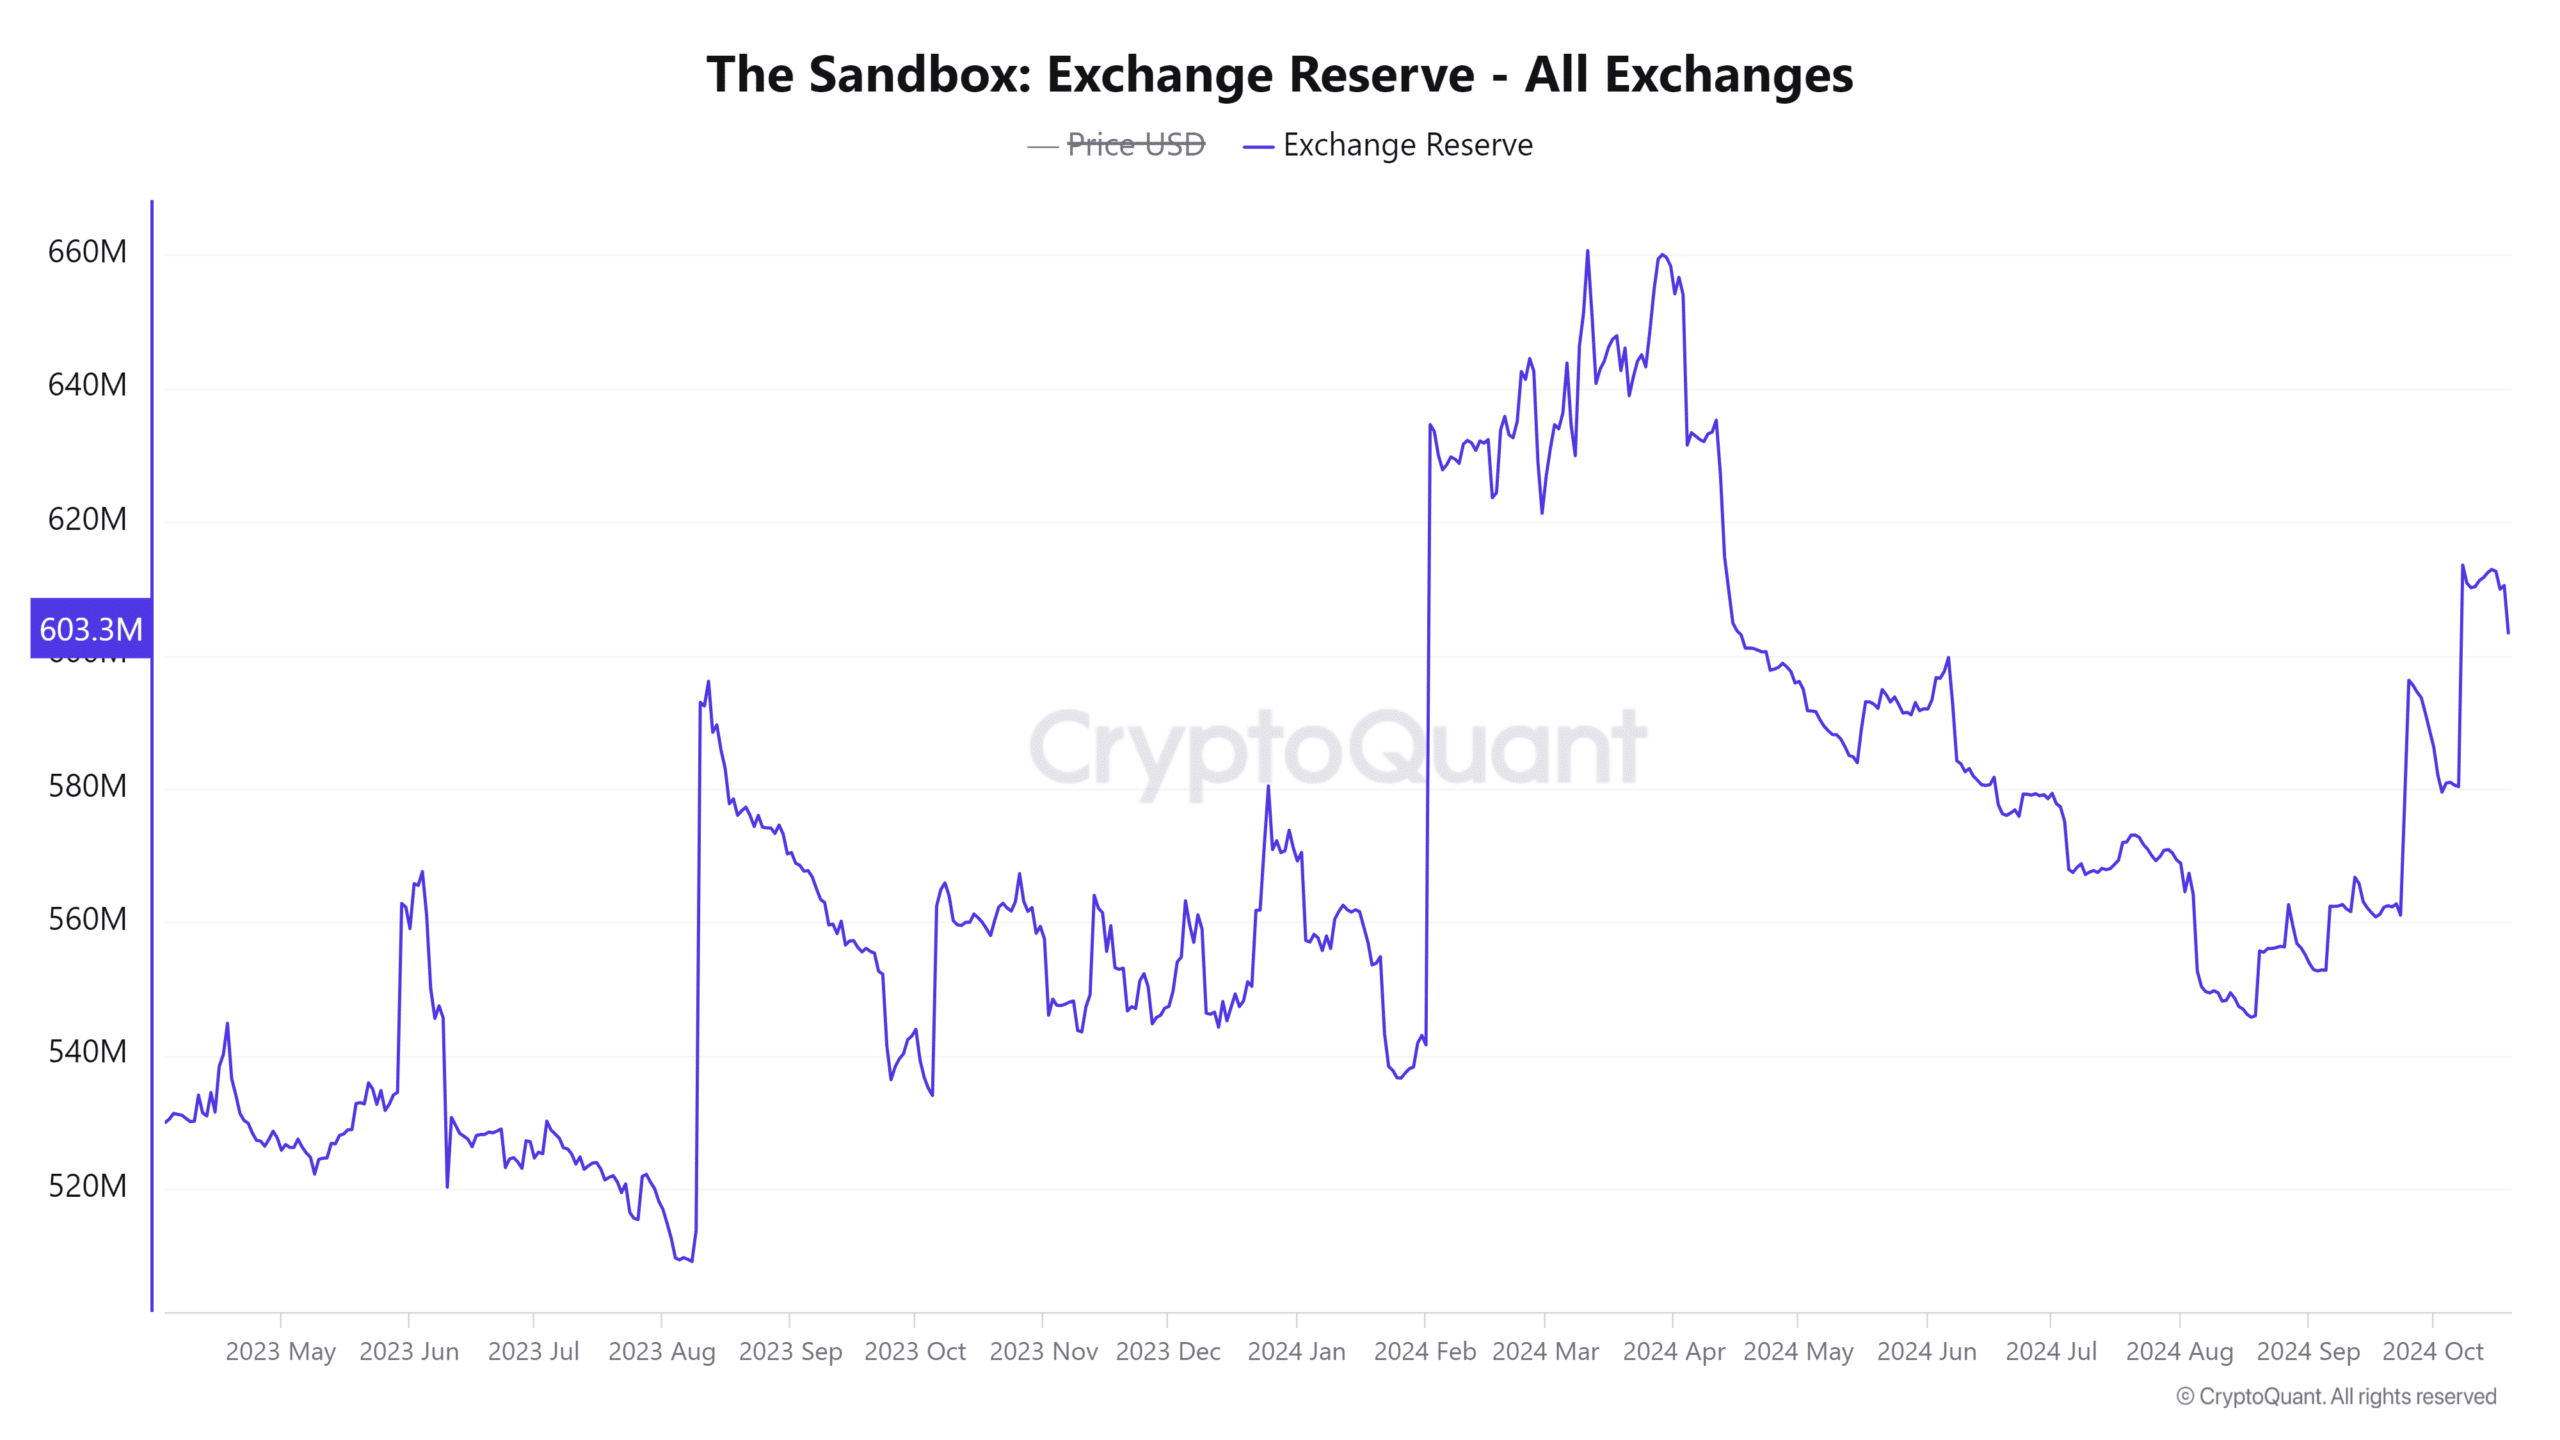
Source: CryptoQuant
Open Interest Spike – Are Traders Confident?
Open interest for Sandbox soared 28.26%, reaching $44.51 million. Such a significant rise suggests that more traders are opening new positions – a sign of confidence in SAND.
Overall, the rise in Open Interest, combined with SAND’s price action, implied growing optimism for sustained gains.
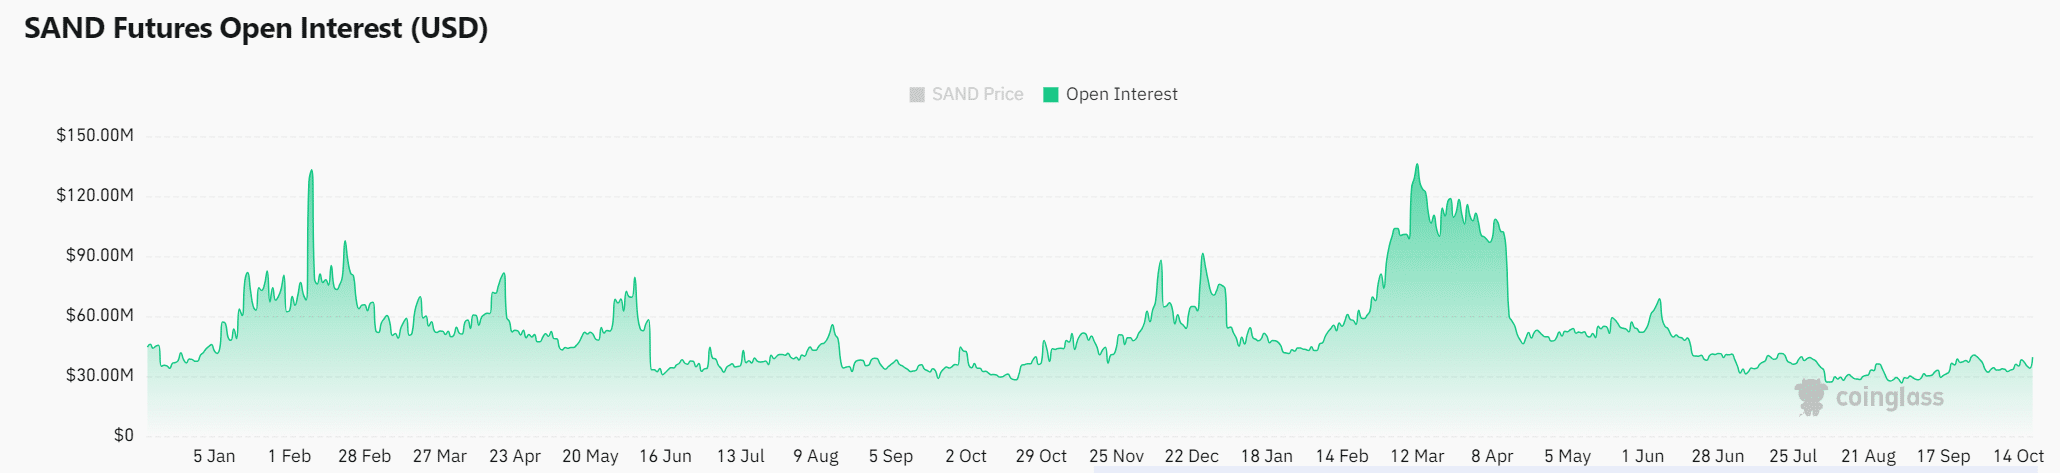
Source: Coinglass
Realistic or not, here is the market capitalization of SAND in terms of BTC
Can SAND maintain its rally?
The altcoin’s breakout, supported by strong technical data and positive on-chain metrics, indicated a potential bullish reversal.
However, sustained buying pressure will be essential to maintain this momentum. Therefore, even though SAND shows promise, traders should proceed with caution amid market volatility.