

This article is also available in Spanish.
Dogecoin got quite an eventful few days in terms of price developments, trade volume, commercial activityand investor interest. Dogecoin led the entire market in terms of inflow, even outperforming Bitcoin last week. This momentum has introduced a compelling change in Dogecoin’s technical outlook, especially with the Bollinger Bands on the DOGE/BTC chart.
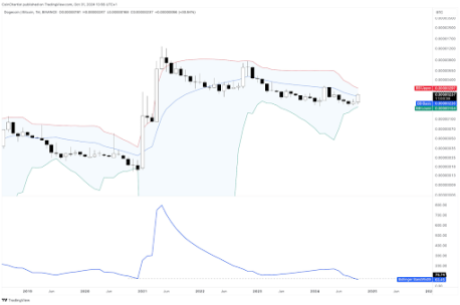
This interesting perspective was underlined by Crypto analyst Tony Severino, who pointed out that Bollinger Bands have tightened to a degree not seen in years. In fact, Severino notes that the bands are now tighter than they were before Dogecoin’s 2021 rally.
Dogecoin Bollinger Bands Tighten to Tightest Level
Bollinger bands are widely used technical indicators that mark the limits of price volatility. When the bands narrow, it usually indicates low volatility. On the other hand, widening bands indicate high volatility. A squeeze, where the bands are moving closer together, suggests that the asset is trading in a tight range. In the case of Dogecoin, Severino’s observation indicates that the DOGE/BTC Bollinger Bands are now closer than they have ever been on a monthly time frame.
Related reading
The last time Bollinger Bands faced such pressure was just before the 2021 rally, which saw the meme coin rise exponentially during the meme coin craze. If the history of the Dogecoin-Bitcoin pair is anything to go by, if the outcome plays out like its previous price movement, Dogecoin could be on the cusp of a strong rally in the coming months that could even lead to more returns than the 2024 rally.
DOGE breaks out of a three-year channel
As previously reported, Dogecoin’s rally over the past few days has been impressive. Notably, Dogecoin saw a 72% surge to peak at $0.176, its highest level in over six months. This upward momentum allowed Dogecoin to break out of a three-year channel trend on the price chart defined by a descending upper trendline tracing back to the 2021 high. This breakout is significant, as it marks the passage of Dogecoin beyond a key resistance level that had contained its growth since the 2021 peak.
Related reading
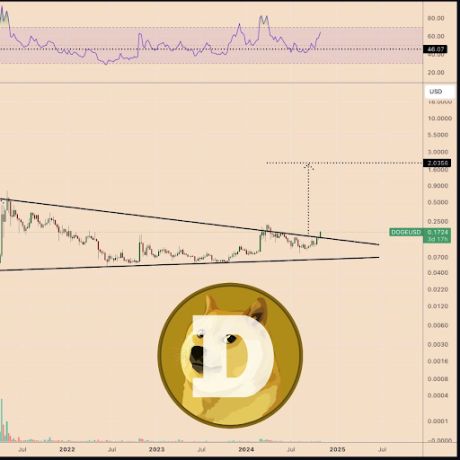
The likelihood of a Dogecoin rally in the coming months has increased significantly due to this breakout, although there remains a possibility of a retest. According to According to a crypto analyst on social media platform X, $2 is a potential top target if momentum continues. It is important to note, however, that several resistance levels lie between the current price and this ambitious target. Two examples of notable resistance levels are the 2024 high of $0.22 and the all-time high of $0.7316.
At the time of writing, Dogecoin price is trading at $0.1585, meaning it reversed about 10% from $0.176 to retest the channel breakout.
Featured image created with Dall.E, chart from Tradingview.com