

On-chain data shows that the XRP network has recently seen a burst of activity and address creation, which could prove to be a bullish signal.
XRP active addresses and network growth have increased recently
According to data from on-chain analytics firm Santiment, address-related metrics have been rising for XRP recently. The first relevant metric here is “daily active addresses,” which tracks the total number of addresses that participate in some sort of forwarding activity on the network each day.
The unique number of active addresses can be considered the same as the number of users using the network, so the value of this metric basically tells us about the amount of traffic the channel receives.
The other metric of interest is network growth, which measures the total number of new addresses created on the network each day. An address is said to be “created” when it makes its first transaction on the blockchain.
While daily active addresses tell us about utility on the network, network growth provides information about the evolution of cryptocurrency adoption.
Here is a chart that shows the trend of daily active addresses and network growth for XRP over the past month:
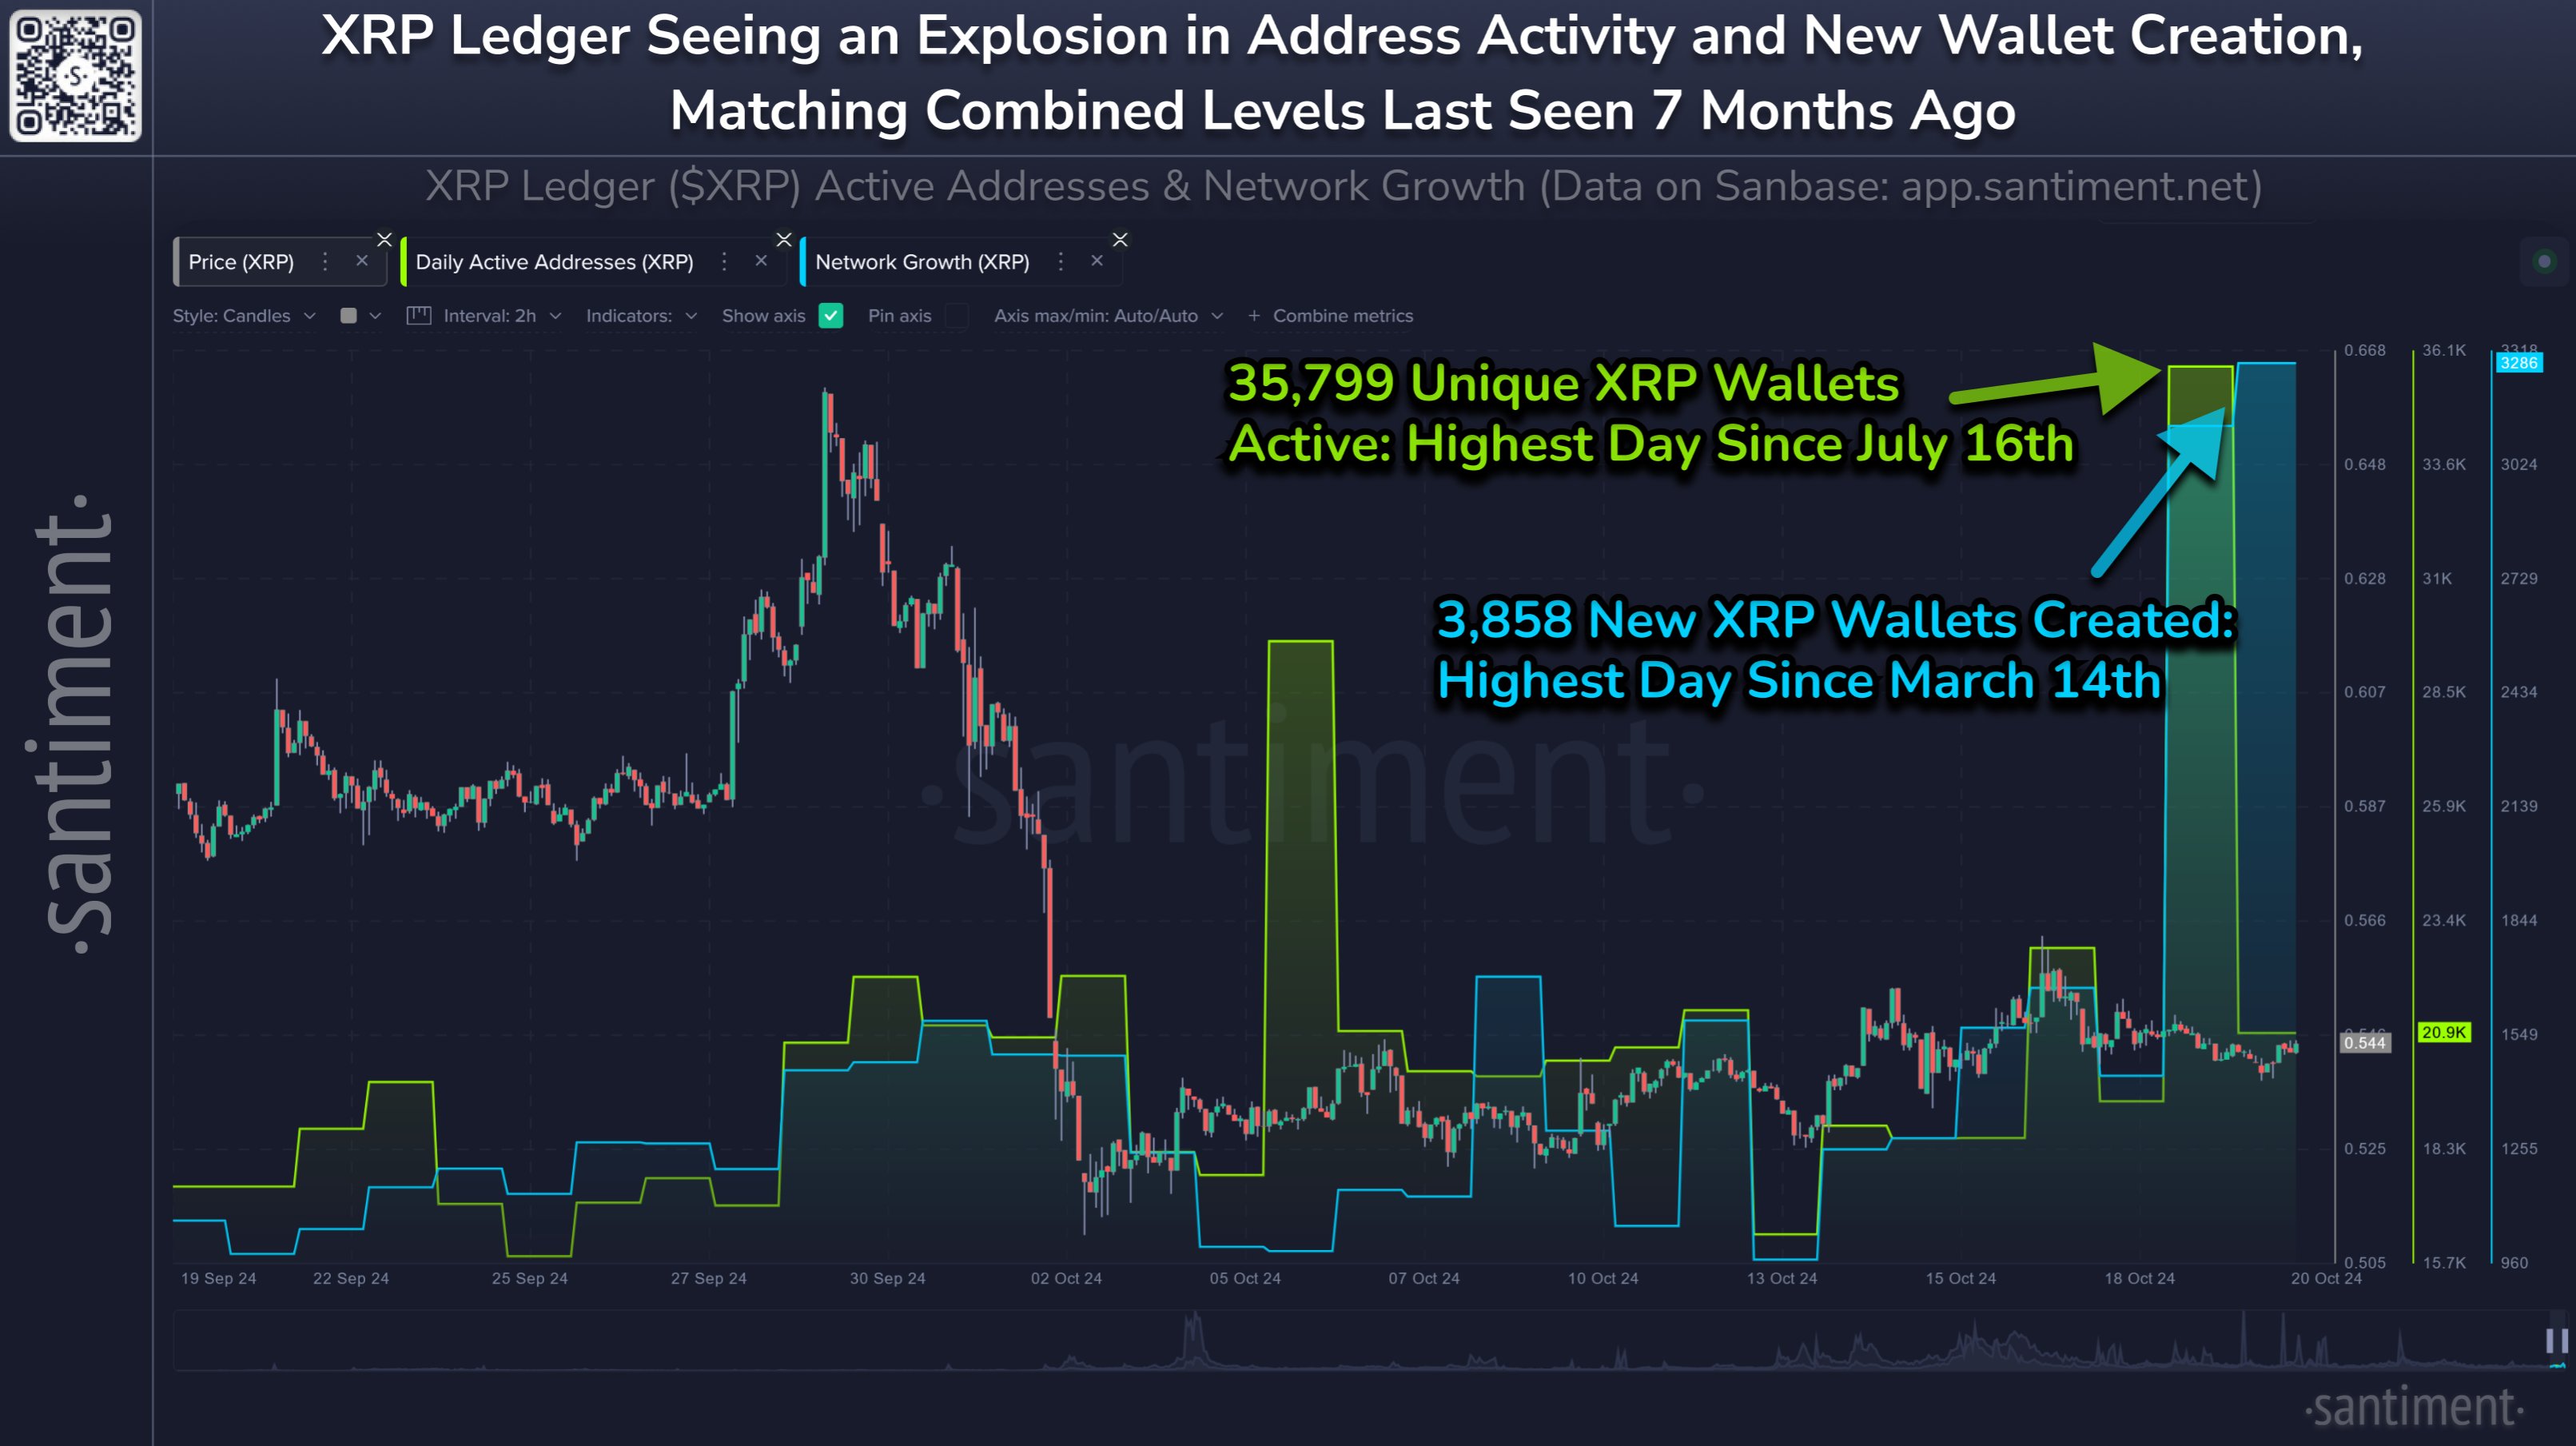
The two indicators appear to have spiked high in recent days | Source: Santiment on X
As seen in the chart above, XRP active addresses and network growth have both seen a sharp increase over the past few days, implying that the network’s utility and adoption have increased.
During this latest boom in activity, the blockchain recorded transactions from 35,799 unique users, marking the highest value since July. Likewise, 3,858 new users joined the network, a peak not seen since March.
As for what these trends could mean for the asset, the answer differs between the two indicators. Adoption is generally a bullish sign in the long term, as a larger user base provides a more sustainable foundation on which future price movements will build. Utility, on the other hand, is usually something that can have short-term effects, since all the high trading activity of users can induce volatility in the price of the coin.
This volatility can cause the asset to move in either direction, depending on the type of activity users are participating in. Daily active addresses by themselves do not contain any information about this distribution, so it can be difficult to speculate on the subject using this indicator alone.
Since the spike in activity occurred while the coin was consolidating, it is possible that users were making a buying surge. If this is the case, then XRP could see the start of a new wave.
XRP Price
XRP has not been able to recover much from its crash earlier this month as its price is still trading around $0.544.
Looks like the price of the coin has been moving sideways over the last few weeks | Source: XRPUSDT on TradingView
Featured image of Dall-E, Santiment.net, chart from TradingView.com