

On-chain data shows that long-term Bitcoin holders have recently participated in a sell-off, a sign that may not be ideal for the price of BTC.
Long-term Bitcoin holders have been distributed recently
As on-chain analyst Checkmate explains in a new article on X, long-term Bitcoin holders just showed their strongest profit-taking of the current cycle.
“Long-term holders” (LTH) refer to BTC investors who have held their coins for more than 155 days. This cohort constitutes one of two major industry divisions based on holding duration, with the other group known as “short-term holders” (STH).
Statistically, the longer an investor holds onto their coins, the less likely they are to sell them at some point. As such, LTHs can be considered to include the market’s diamond hands, while STHs consist of the weak hands.
Although LTHs don’t sell out too often, it appears that the latest price rally was too good of a profit-taking opportunity for even these HODLers to miss.
There are several ways to track the behavior of this cohort, one of them being how much supply they “spend.” Below is the chart shared by the analyst that shows the 30-day value and cumulative value trend of this Bitcoin metric since November 2022.
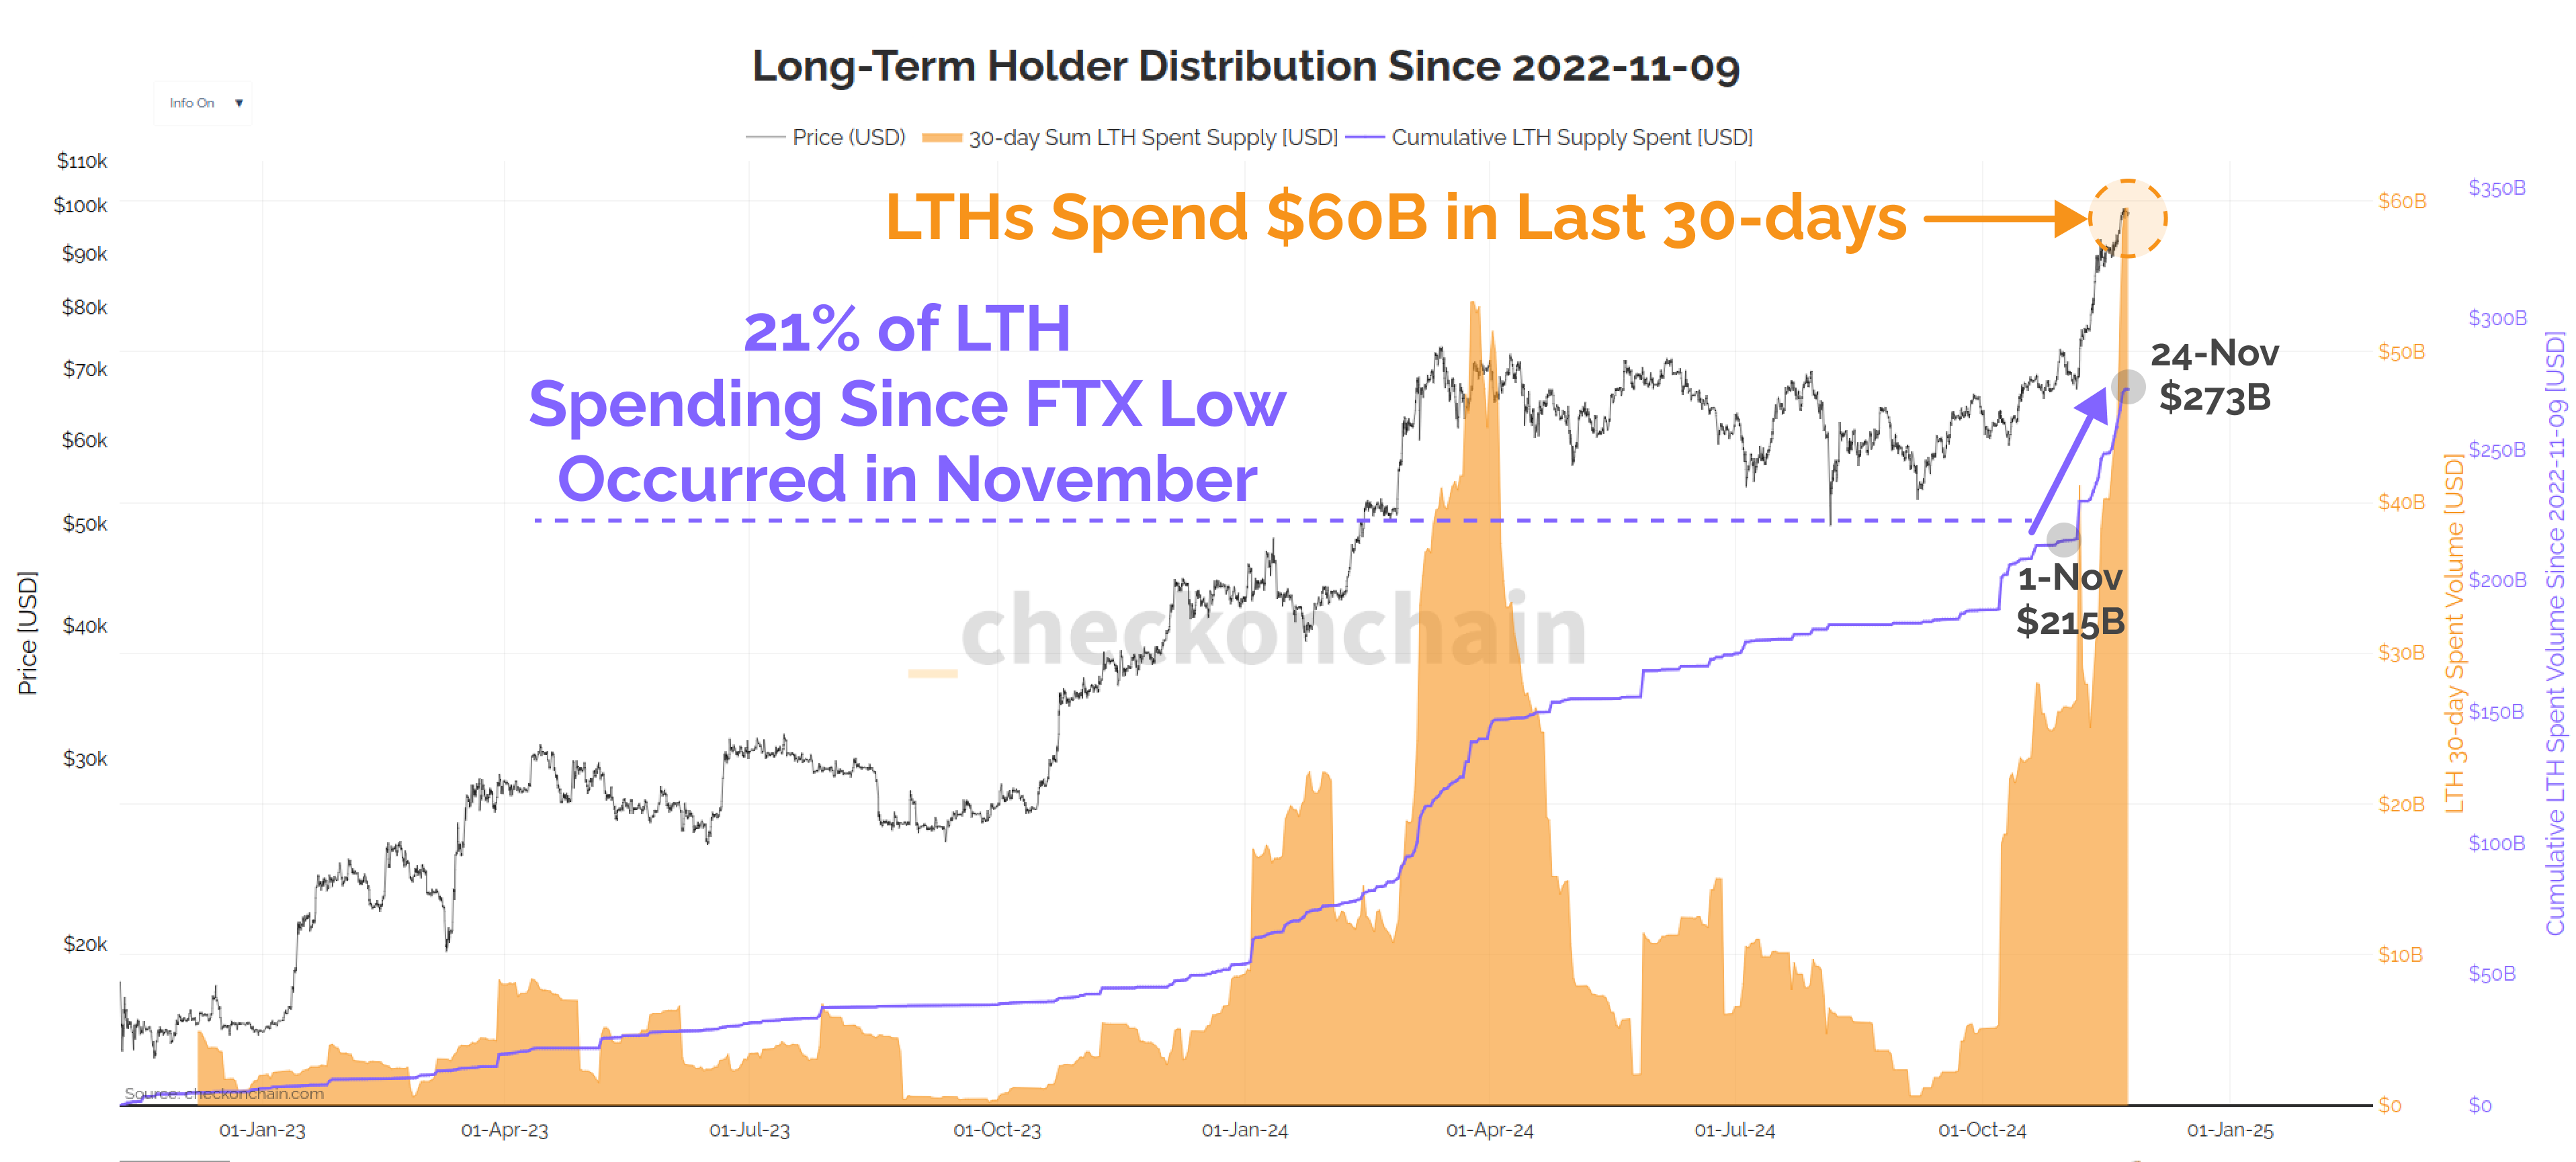
The value of the metric appears to have been quite high in recent days | Source: @_Checkmatey_ on X
As the chart shows, Bitcoin LTH has recently seen its 30-day supply reach high levels. In total, these investors have transferred around $60 billion worth of tokens over the past month.
Typically, whenever these investors decide to come out of dormancy, it’s for selling purposes, so this whole move is likely to be correlated with a selloff in the group.
Naturally, with this increase in 30-day spent supply, the cumulative value of spent supply has also climbed. In the context of the current chart, this latter metric tracks the cumulative value of the distribution amount made by LTHs since November 2022.
The reason Checkmate chose this month as the limit is because BTC found the bottom of its last bear market that month after the FTX crash. In other words, the month is the start of the asset’s “current” cycle.
Currently, the indicator stands at $273 billion. This means that last month’s LTH distribution represented approximately 21% of the entire supply spent since the start of the cycle.
From the chart, it is clear that these diamond hands also participated in a massive sell-off in the first quarter of the year and it was perhaps this sell-off that forced Bitcoin into a consolidation phase.
Given this trend, it would be interesting to see if recent sales would have a similar effect on BTC or if demand this time around is high enough to overcome this obstacle.
BTC Price
At the time of writing, Bitcoin is trading around $95,500, up more than 8% from last week.
Looks like the price of the coin has seen a plunge over the past day | Source: BTCUSDT on TradingView
Featured image of Dall-E, checkonchain.com, chart from TradingView.com