

On-chain data shows that Bitcoin mining hash rate has rebounded recently, suggesting that miners are starting to expand their rigs again.
Bitcoin mining hash rate rebounds from recent lows
“Mining hash rate” refers to a metric that tracks the amount of computing power that Bitcoin miners currently have connected to the network. It is measured in units of terahash per second (TH/s).
When the value of the metric increases, existing miners expand their facilities and new miners join the network. Such a trend implies that miners find the network attractive.
On the other hand, a drop in the indicator suggests that some miners have decided to disconnect from the blockchain, probably because they no longer find mining profitable.
Now here is a chart that shows the trend of the 7-day moving average (MA) of Bitcoin mining hash rate over the past year:
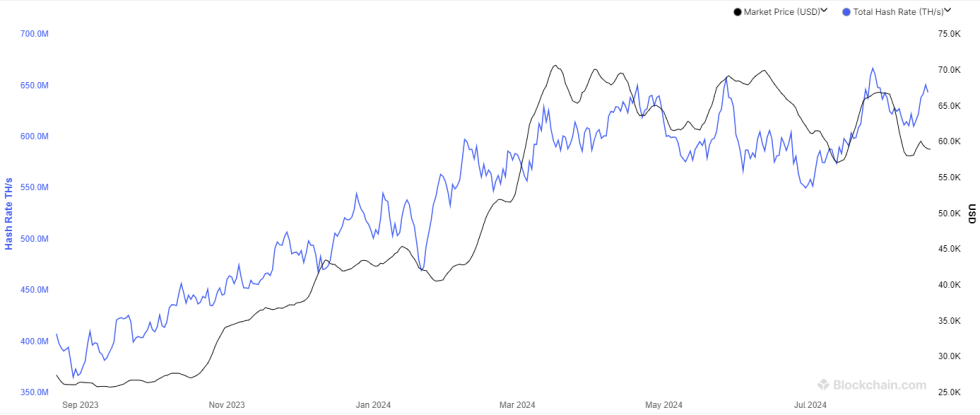
The value of the metric appears to have been going up in recent days | Source: Blockchain.com
As seen in the chart above, Bitcoin’s 7-day mining hash rate dropped to around 610 million TH/s earlier this month, down from an all-time high of 667 million TH/s in late July. The reason behind this trend is likely the bearish momentum that BTC witnessed during the period.
Miners earn most of their revenue from the block subsidy, which is paid at a fixed BTC rate and at a fixed time interval. Thus, the only variable tied to these rewards is the USD price of the cryptocurrency. The previous decline in the asset has had a drastic effect on miners’ finances.
BTC had dropped to below $50,000 during that crash, but the asset has since seen a notable recovery, although it is still far from the $70,000 level it occupied towards the end of last month.
Interestingly, despite the lackluster recovery, the 7-day MA mining hash rate has seen a sharp rebound over the past week, reaching 650 TH/s two days ago. It seems that some miners are betting on a better outcome for the asset soon.
A popular indicator used to track the status of BTC miners based on hash rate is “Hash Ribbons”. The ribbons here refer to the 30-day and 60-day moving averages of hash rate.
When the former falls below the latter, miners are considered to be going through a capitulation phase, as they quickly take their computing power offline. Historically, BTC has tended to bottom out when miners are struggling.
On-chain analytics firm CryptoQuant discussed the latest trend in this metric in a new article on X.
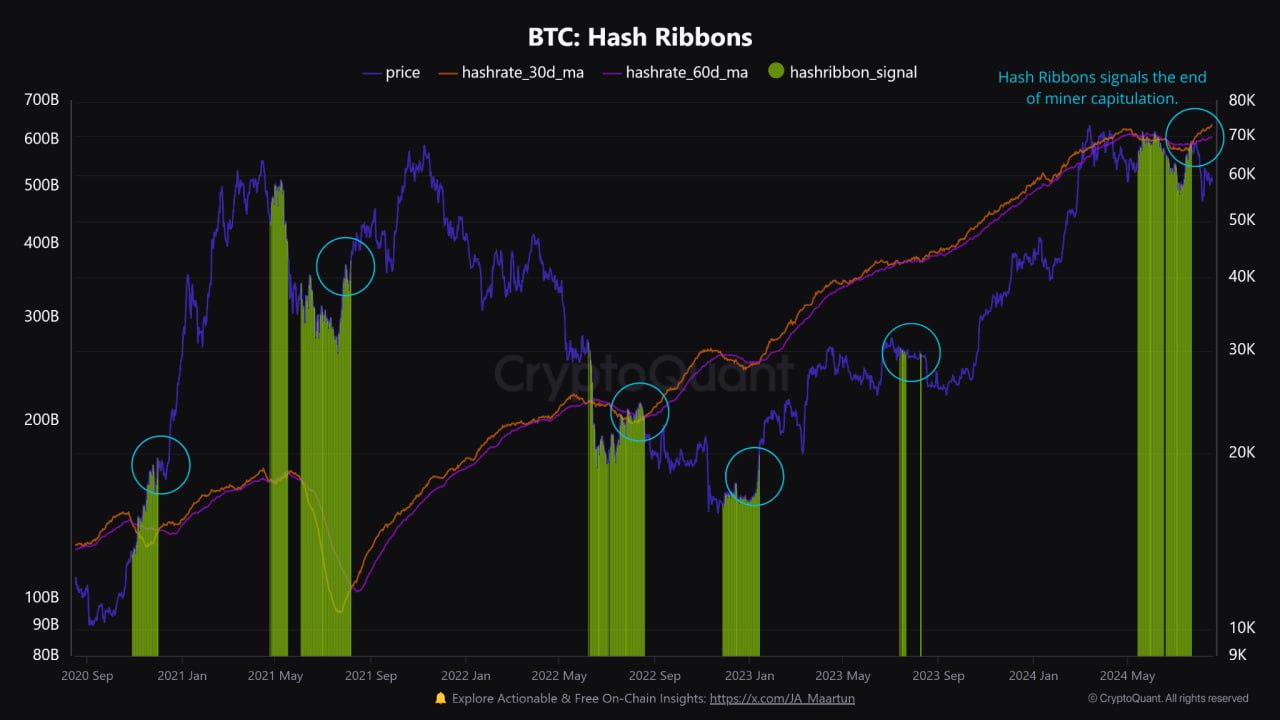
The data for the Hash Ribbons over the last few years | Source: CryptoQuant on X
The chart shows that Bitcoin hash rate ribbons had given a capitulation signal earlier, but the 30-day MA has since crossed above the 60-day MA.
“While the indicator is not intended to determine the exact lowest price, it often precedes higher prices by signaling a reduction in miner selling pressure,” CryptoQuant explains.
BTC Price
At the time of writing, Bitcoin is trading at around $58,800, down 4% from last week.
Looks like the price of the asset has been moving sideways over the last few days | Source: BTCUSD on TradingView
Featured image by Dall-E, CryptoQuant.com, chart by TradingView.com