

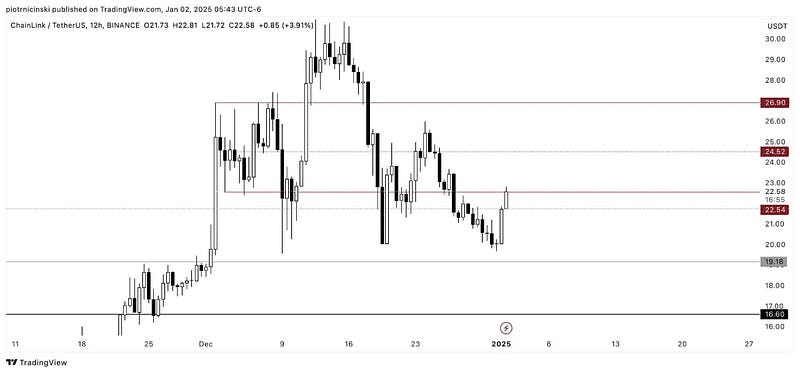
- LINK found significant support at $22.54, previously a resistance level.
- Historically, rising open interest during a consolidation phase, as seen in LINK’s chart, often precedes a significant price movement.
Chainlink (LINK) is well known for its crucial role in connecting smart contracts with real-world data. Recently, it showed promising price movement on its chart.
This resilience at new support levels suggests the possibility of a breakout higher, potentially putting it on the path to a new all-time high.
However, past trends and external metrics reveal mixed signals, prompting traders to remain vigilant.
Resistance turns into support
In the 12-hour chart, LINK found significant support at $22.54, previously a resistance level. This classic “reversal of support” leads traders to speculate whether the coin will resume its upward momentum.
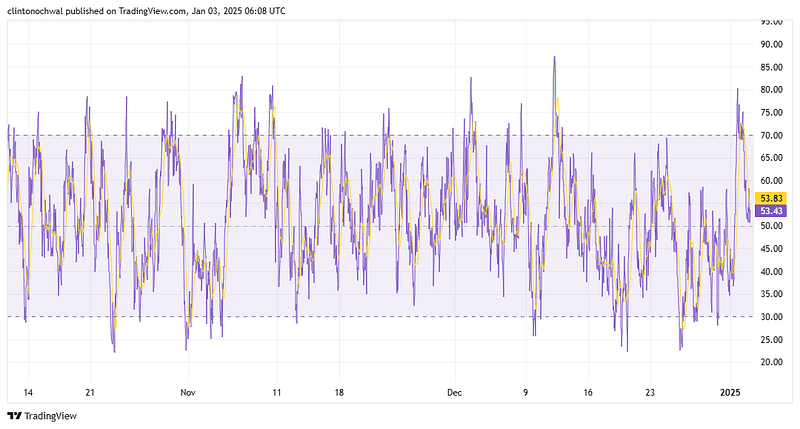
The relative strength index (RSI), a key technical indicator, was hovering near 50 at press time, reflecting neutral market sentiment.
Trading View
The current consolidation indicates market indecision, which corresponds to LINK’s struggle to close decisively above $22.58. This pattern often precedes a breakout or breakdown.
If LINK breaks above the next resistance level at $24.52, it could target $26.90 or higher. However, failure to hold $22.54 as support could lead to a retest of the $19.16 region.
Trading View
Given Chainlink software services revenue doubling from 2022 to 2023, institutional interest could provide bullish momentum.
However, historical price trends indicate that LINK could remain moderate in this range, especially with its lower and volatile timeframes. Traders should closely monitor the RSI and price action for clearer signals.
Open Interest Analysis
Open interest (OI) for LINK has seen a steady increase in recent days, signaling increased trader activity and interest in the market. Currently, LINK’s OI has increased by around 8%, reflecting the renewed commitment of both bulls and bears.
Historically, rising OI during a consolidation phase, as seen in LINK’s chart, often precedes a significant price movement. If the price breaks above the resistance at $24.52, we could see an influx of new positions, which would further push OI higher.
However, if LINK wobbles and drops below $22.01, the OI could decline as traders liquidate their positions to minimize risks. This trend highlights the importance of monitoring OI alongside price action to effectively predict potential breakouts or breakdowns.
Market sentiment remains neutral
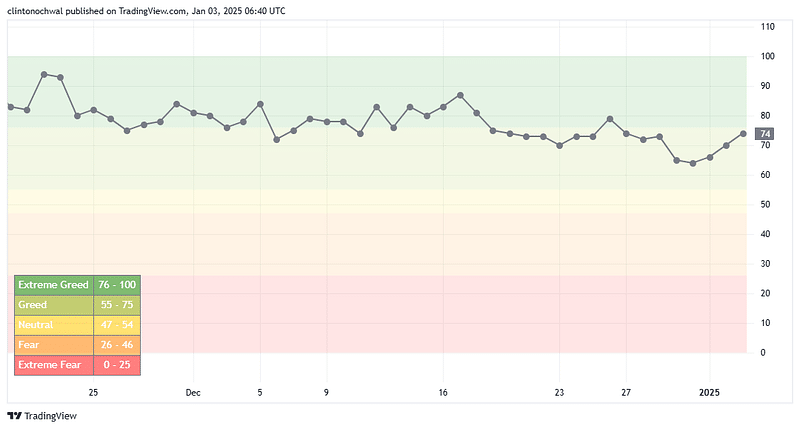
The Crypto Fear and Greed Index recently recorded a reading of 64, indicating increased bullish sentiment. This marks a change from previous neutral figures, reflecting growing optimism among market participants.
Trading View
Historically, scores above 60 suggest growing confidence, often aligned with a price surge or asset accumulation. For LINK, this growing sense of greed could lead to sustained buying pressure, potentially pushing the price above its current resistance of $24.52.
However, traders should remain cautious. Increased greed usually precedes short-term corrections, as profit-taking tends to increase in overheated conditions.
If sentiment pushes further into the extreme greed zone (above 76), LINK could attempt to challenge the $26.90 level or higher. Conversely, a decline in sentiment toward neutral levels could coincide with a retest of $22.01 or lower.
Broader Market Trends
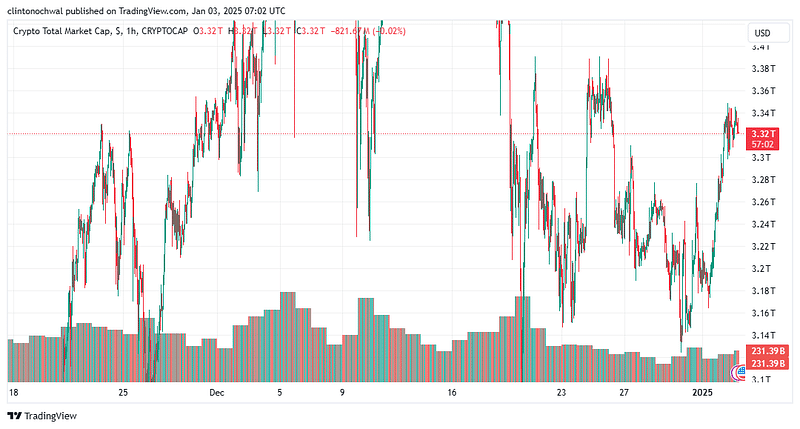
Total cryptocurrency market capitalization, a key metric for gauging the overall health of the cryptocurrency market, recently rebounded from $3.2 trillion and is now around $3.3 trillion.
This rally aligns with cautious optimism in the broader market, supported by growing institutional interest in altcoins such as LINK, Solana’s (SOL), and Ethena (ENA).
However, the total market capitalization remains below its previous high of $3.65 trillion, indicating that the market is still in a corrective phase.
Trading View
Chainlink’s performance reflects broader market dynamics. The coin’s consolidation around the $22.54 support level reflects the market’s hesitancy to make significant bullish moves.
A sustained increase in total market capitalization above $3.65 trillion could serve as a bullish catalyst for LINK, pushing it towards $26.90 and potentially above $30. Conversely, a decline below $3.2 trillion could strengthen bearish sentiment, forcing LINK to retest lower levels.
Is your wallet green? Check out the LINK Profit Calculator
External factors, such as regulatory developments and macroeconomic trends, continue to influence the total market capitalization and, by extension, LINK.
Recent UK government filings revealing Chainlink’s revenue doubling in 2023 highlight the growing utility of blockchain technologies in the real world, potentially attracting more capital to the market.
Chainlink remains one of the most promising projects in crypto, with strong revenue growth and increasing institutional interest. Even though the current technical setup and market sentiment suggests consolidation, the potential for a breakout cannot be ignored.