

This article is also available in Spanish.
Dogecoin (DOGE) is currently trading at a pivotal level following a 17% retracement from its recent highs around $0.179. This pullback has brought DOGE into a significant demand zone, attracting the attention of leading analyst Daan, who recently shared technical analysis identifying this level as an accumulation opportunity. According to Daan, the current support zone could serve as a launching pad if buying pressure intensifies, positioning DOGE for a potential rebound.
However, the coming days are expected to bring increased volatility and uncertainty, primarily due to the approach of the US elections and their anticipated impact on financial markets. Since broader market sentiment often influences Dogecoin, this period could feature price fluctuations as traders adapt to both political developments and economic responses.
Related reading
The key now is whether Dogecoin can sustain above this demand zone. If buyers step in and support the development, a recovery could see DOGE attempt to reach its recent highs again or push even further.
Conversely, failing to maintain this level could lead to a deeper retracement. Investors are watching this area closely, recognizing that Dogecoin’s next moves will be shaped by internal market techniques and external conditions in the days to come.
Dogecoin at key levels
Crypto analyst Daan recently shared detailed technical analysis on While DOGE is trading around $0.151, Daan notes that this price level has acted as a resistance zone for several weeks, making it a key area for potential buying.
In his analysis, Daan highlights that the upcoming US election adds a significant layer of uncertainty to the market, calling it a “draw” for near-term price direction. He explains that the election outcome could impact both traditional and crypto markets, which could result in temporary downward pressure or a surprising upward move depending on the results and overall sentiment. walk. Yet for Dogecoin in particular, he believes that if the price continues to decline to these strategic levels, the risk/reward ratio could be favorable for buyers looking to “take a chance.”
Daan also notes that Monday could provide further opportunities if DOGE declines, although he recommends caution due to likely volatility in the coming days. The analyst points out that while these are risky conditions, the ability to accumulate DOGE to historically significant levels may pay off if overall market sentiment aligns favorably after the election.
Related reading
Ultimately, the next few days for Dogecoin look both volatile and uncertain, and whether it holds the $0.151 mark or falls further could set the stage for the coin’s next move. Investors watching DOGE closely are aware of both technical setup and external market factors, hoping for an eventual rebound in this tumultuous environment.
DOGE technical view
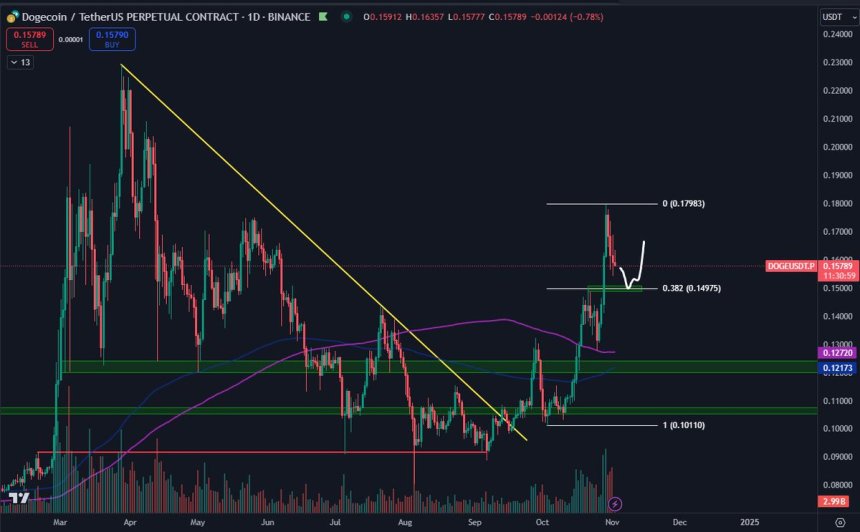
Dogecoin is currently trading at a key level of $0.151, where the previous supply has now moved into a crucial demand zone. This level will be key for bulls looking to regain momentum and push DOGE to new highs. Sustaining above $0.151 is key to establishing a base that could propel the price higher, providing the market confidence needed for a possible uptrend.

However, if DOGE fails to maintain this level, it could trigger a pullback towards the next major demand zone around $0.135. This lower level has served as support in the past and could serve as a crucial point of accumulation if selling pressure increases.
Related reading
The coming days will reveal whether buyers can defend this $0.151 zone or if a deeper correction is on the horizon. A move above current levels would give DOGE the bullish push needed to test higher resistance zones and potentially establish a stronger uptrend. Conversely, a loss of support here would indicate that sellers are still in control, which would prepare DOGE for a retest of lower demand levels. As volatility remains elevated, traders are closely monitoring these critical support and resistance points.
Featured image of Dall-E, chart by TradingView