

- Dogecoin was testing key resistance at $0.12 after breaking a 6-month downtrend.
- On-chain data showed increasing network activity and accumulation as traders eye a breakout beyond $0.12.
Dogecoin (DOGE) finally broke free from a 6-month downtrend, sparking optimism among traders. DOGE was trading at $0.1025 at the time of going to press, showing an increase of 5.37% over the last seven days despite a slight 24-hour decline of -2.88%.
With a market cap of nearly $15 billion and a 24-hour trading volume of $553 million, Dogecoin was testing key resistance levels as traders focused on the $0.12 mark to trigger a significant upward move.
A falling wedge pattern, along with an inverse head and shoulders formation, suggest a potential bullish reversal for DOGE.
Both patterns indicate that a breakout could be on the horizon, especially if the price breaks above the critical resistance level of $0.1200, which has previously acted as both support and resistance.
Critical Levels for Dogecoin: Support at $0.1050 and Resistance at $0.1200
As Dogecoin approaches key technical levels, traders are keeping a close eye on the $0.1200 resistance level. A break above this price could trigger a strong rally, potentially pushing DOGE towards $0.20.
The area between $0.1050 and $0.1200 is considered a crucial range, and a sustained move above $0.1200 may indicate a shift in market sentiment from bearish to bullish.
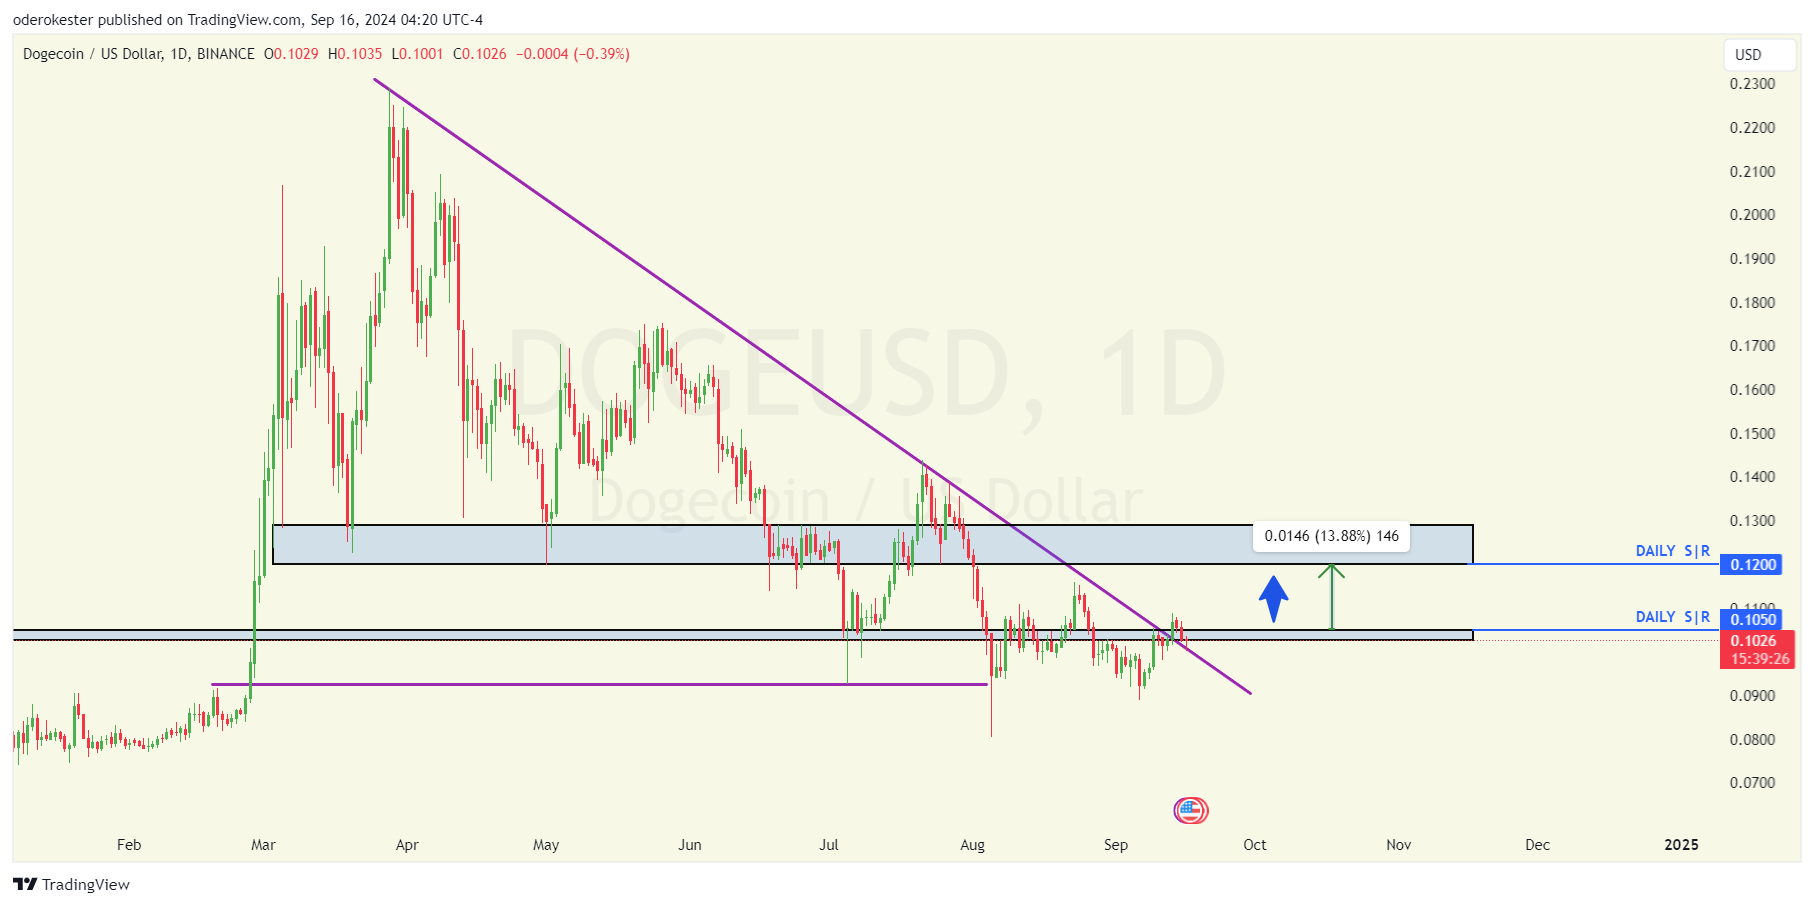
Source: TradingView
However, DOGE also needs to hold above the $0.1050 support level to maintain its upward trajectory. A drop below this level could lead to further declines, forcing the price back into a consolidation phase.
Analysts highlight the importance of momentum at these levels, with the next few trading sessions likely to be crucial in determining DOGE’s short-term direction.
Technical indicators point to a potential breakout
Dogecoin’s technical indicators are showing mixed signals, with both caution and optimism. The Relative Strength Index (RSI) is currently neutral at 47.45, suggesting that DOGE is neither overbought nor oversold.
If the RSI rises above 50, it could indicate further bullish momentum.
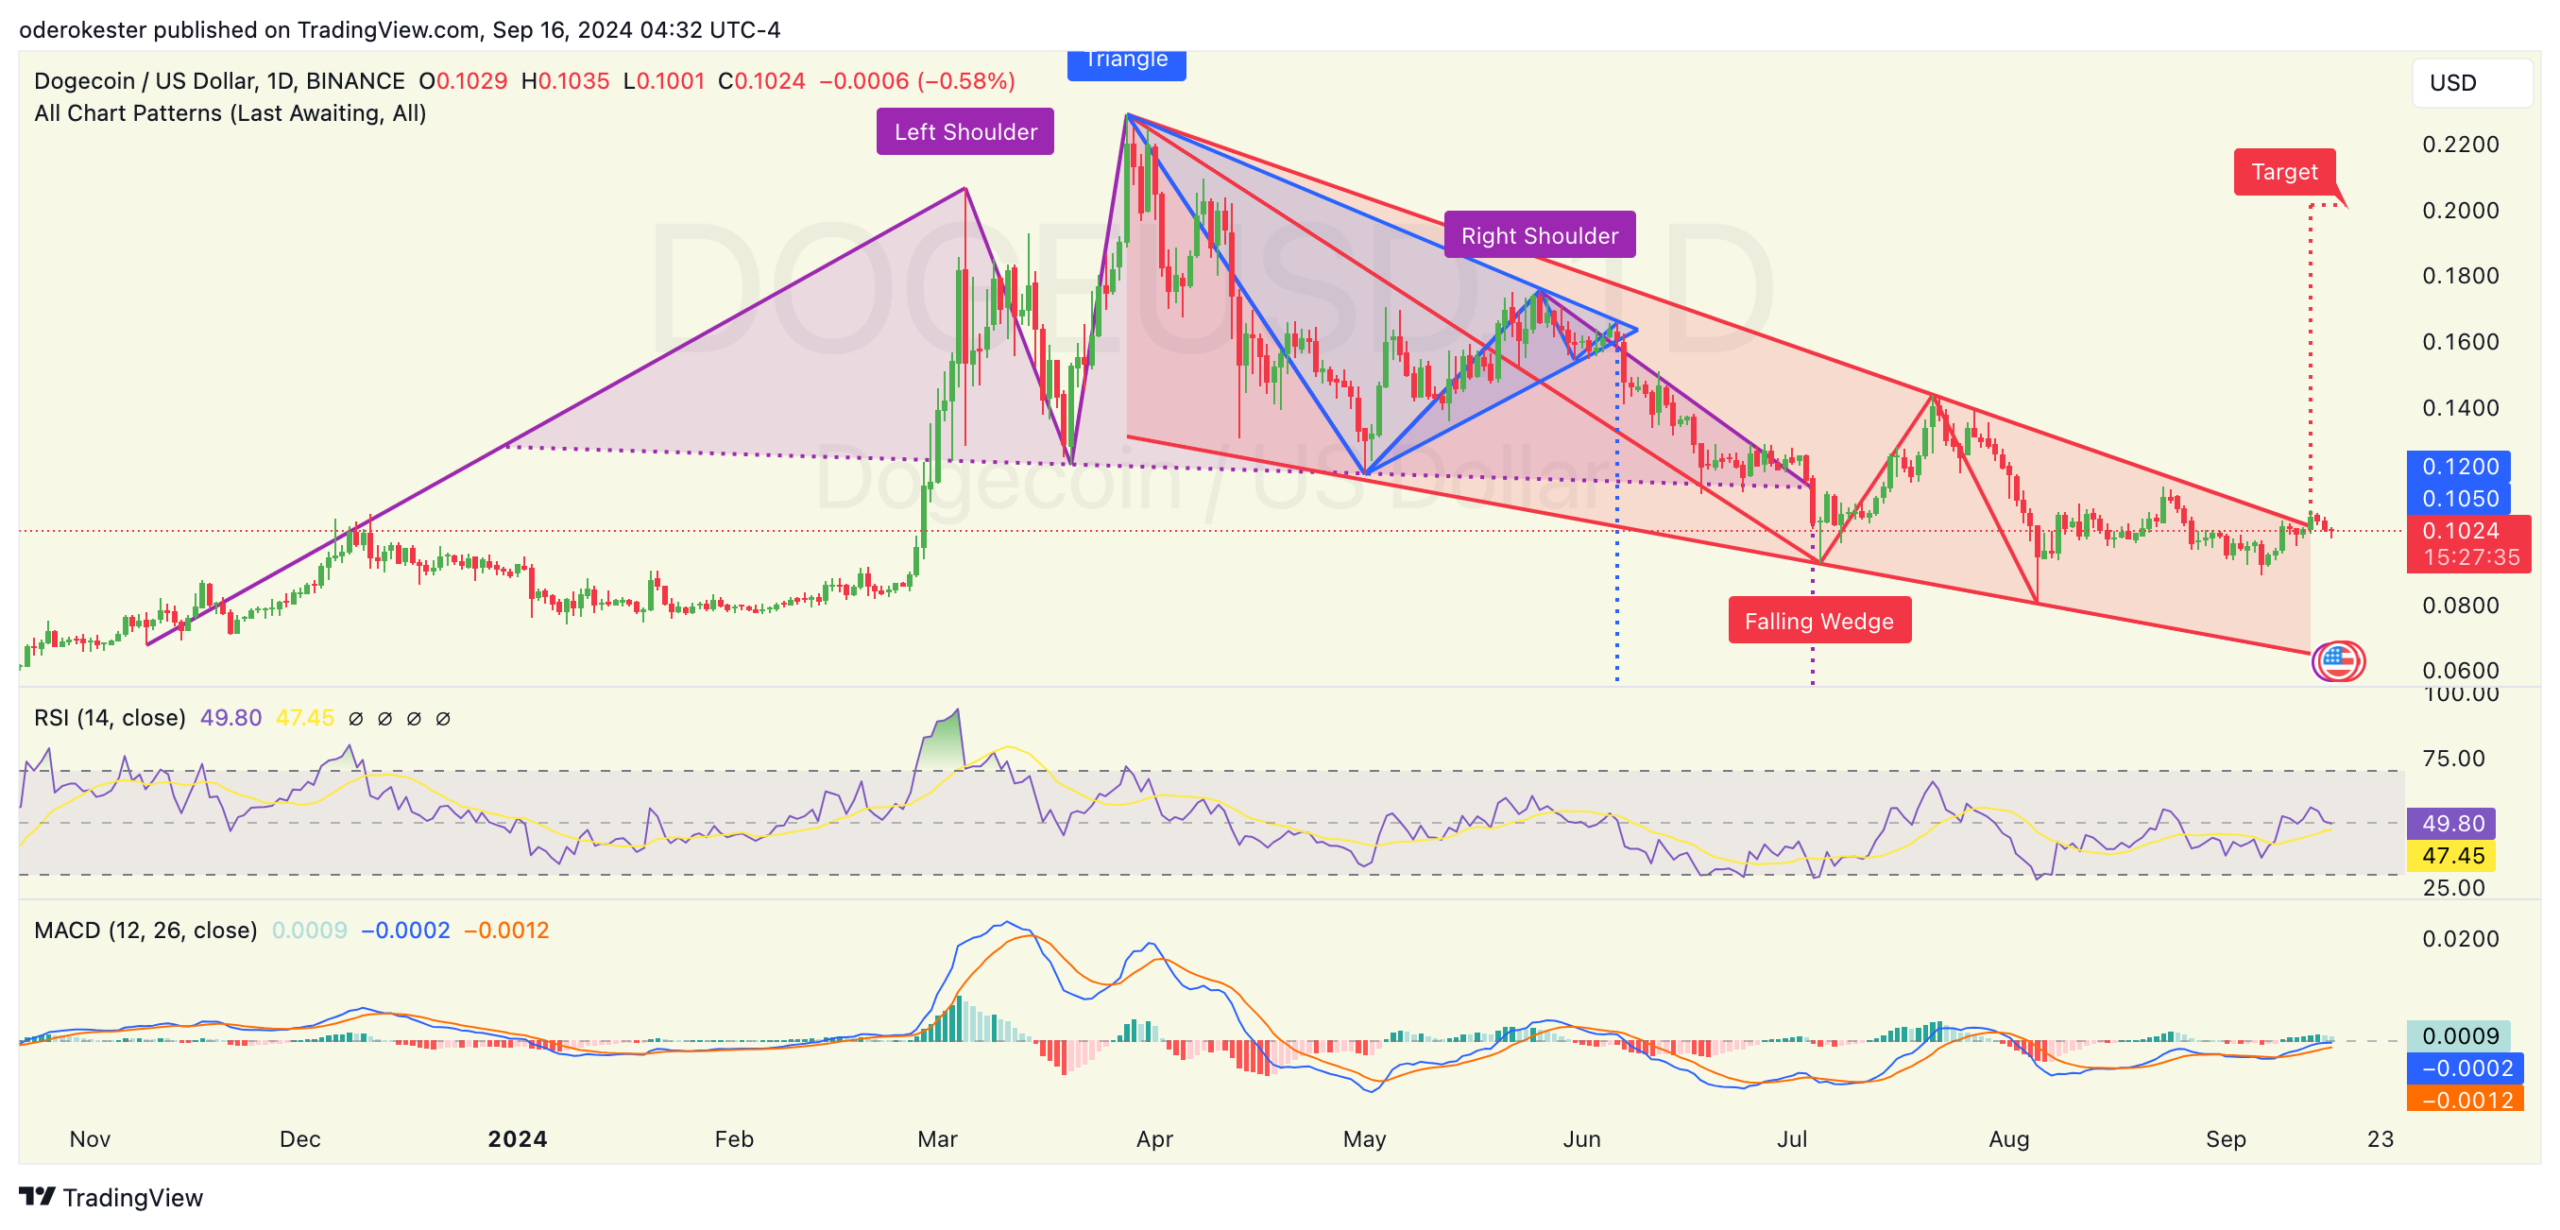
Source: TradingView
Meanwhile, the Moving Average Convergence Divergence (MACD) is on the verge of a bullish crossover, although the signal remains weak at this point.
If the price breaks above the $0.1200 resistance level, it could confirm the MACD crossover and provide additional momentum for a rally.
Critical levels to watch include support at $0.1050 and resistance at $0.1200, with a potential target of $0.2000 if a break occurs.
On-chain indicators show growing interest in Dogecoin
According to In the blockDogecoin’s on-chain data reveals increasing network engagement, which could support the current price movement. As of September 15, Dogecoin had 74,830 total addresses, with 12,480 new addresses added that day.
The number of active addresses stands at 44,870, indicating growing participation within the network.
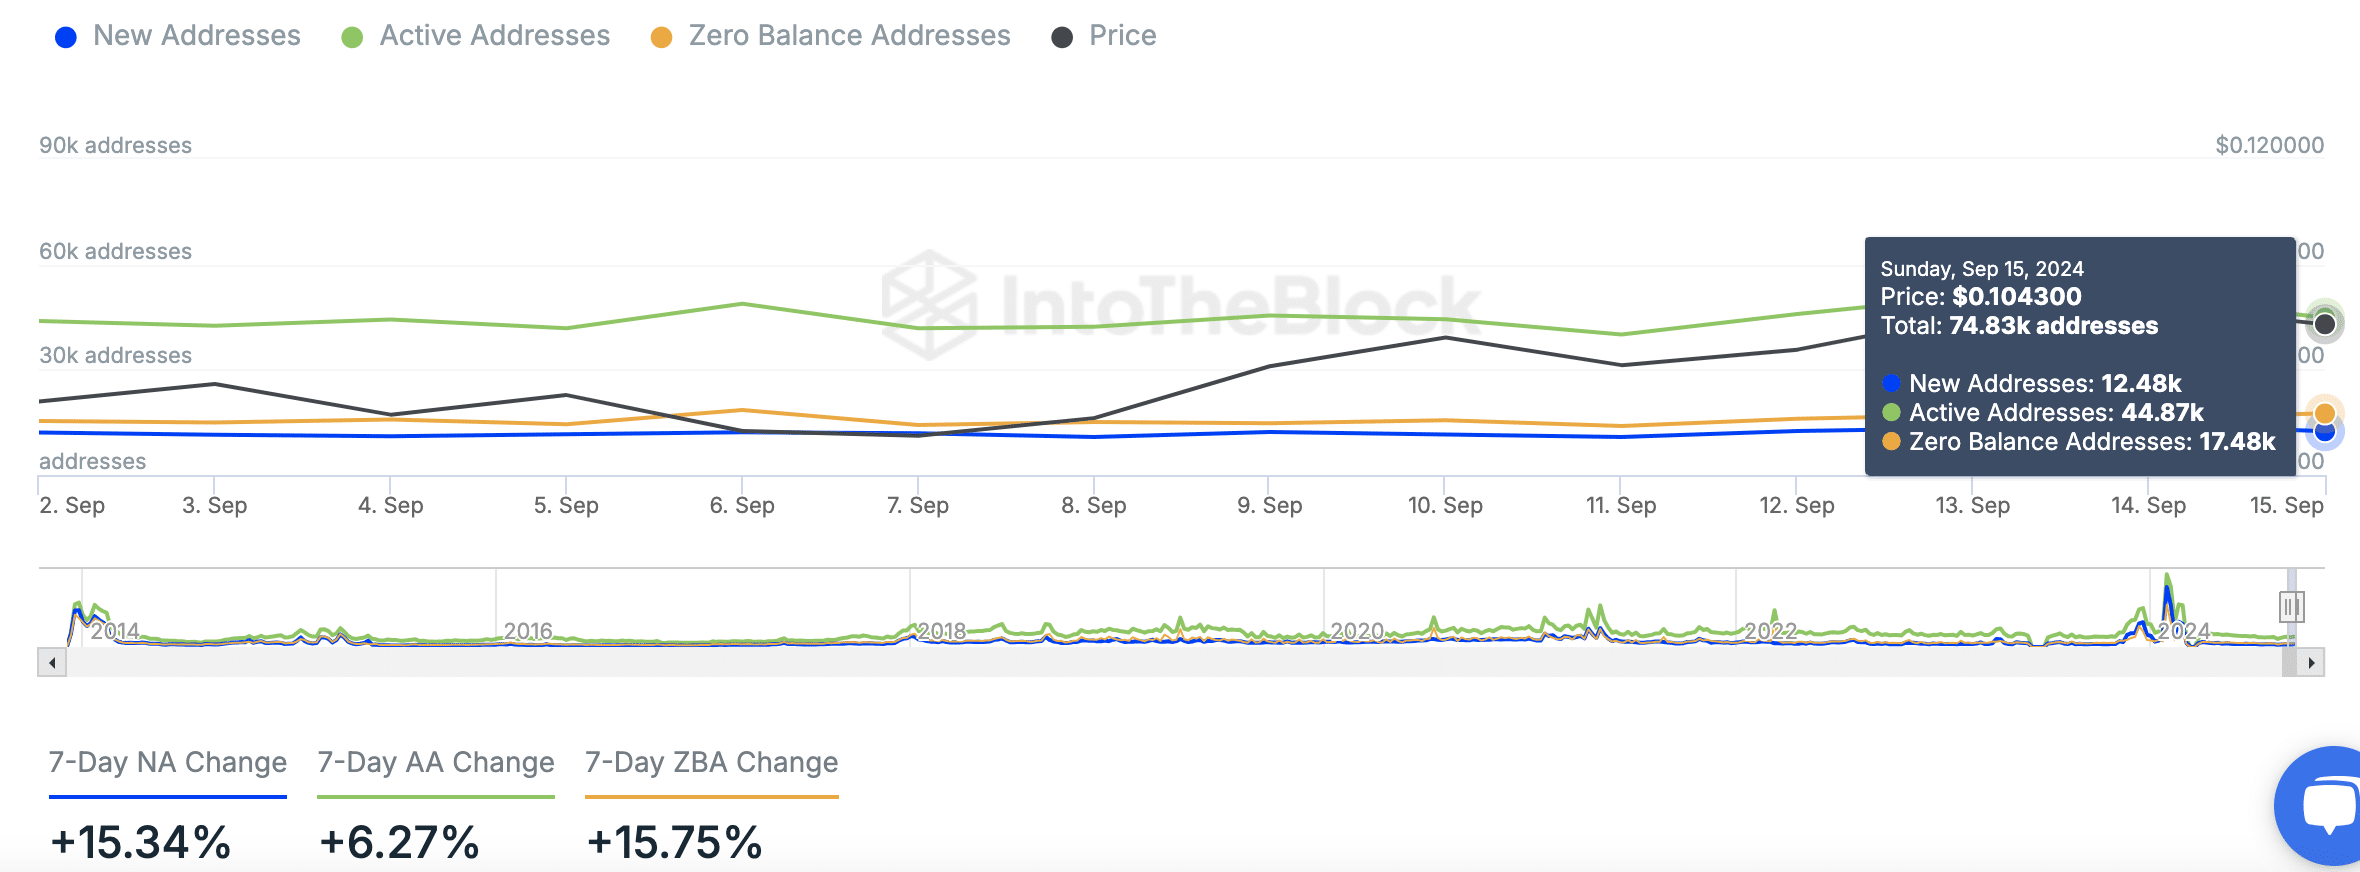
Source: IntoTheBlock
Additionally, Dogecoin saw 349,100 transactions, with a 7-day transaction average of 275,660. The highest number of transactions last week was on September 13, with 461,370 transactions.
This constant network activity indicates constant user interest, even if the price fluctuates.
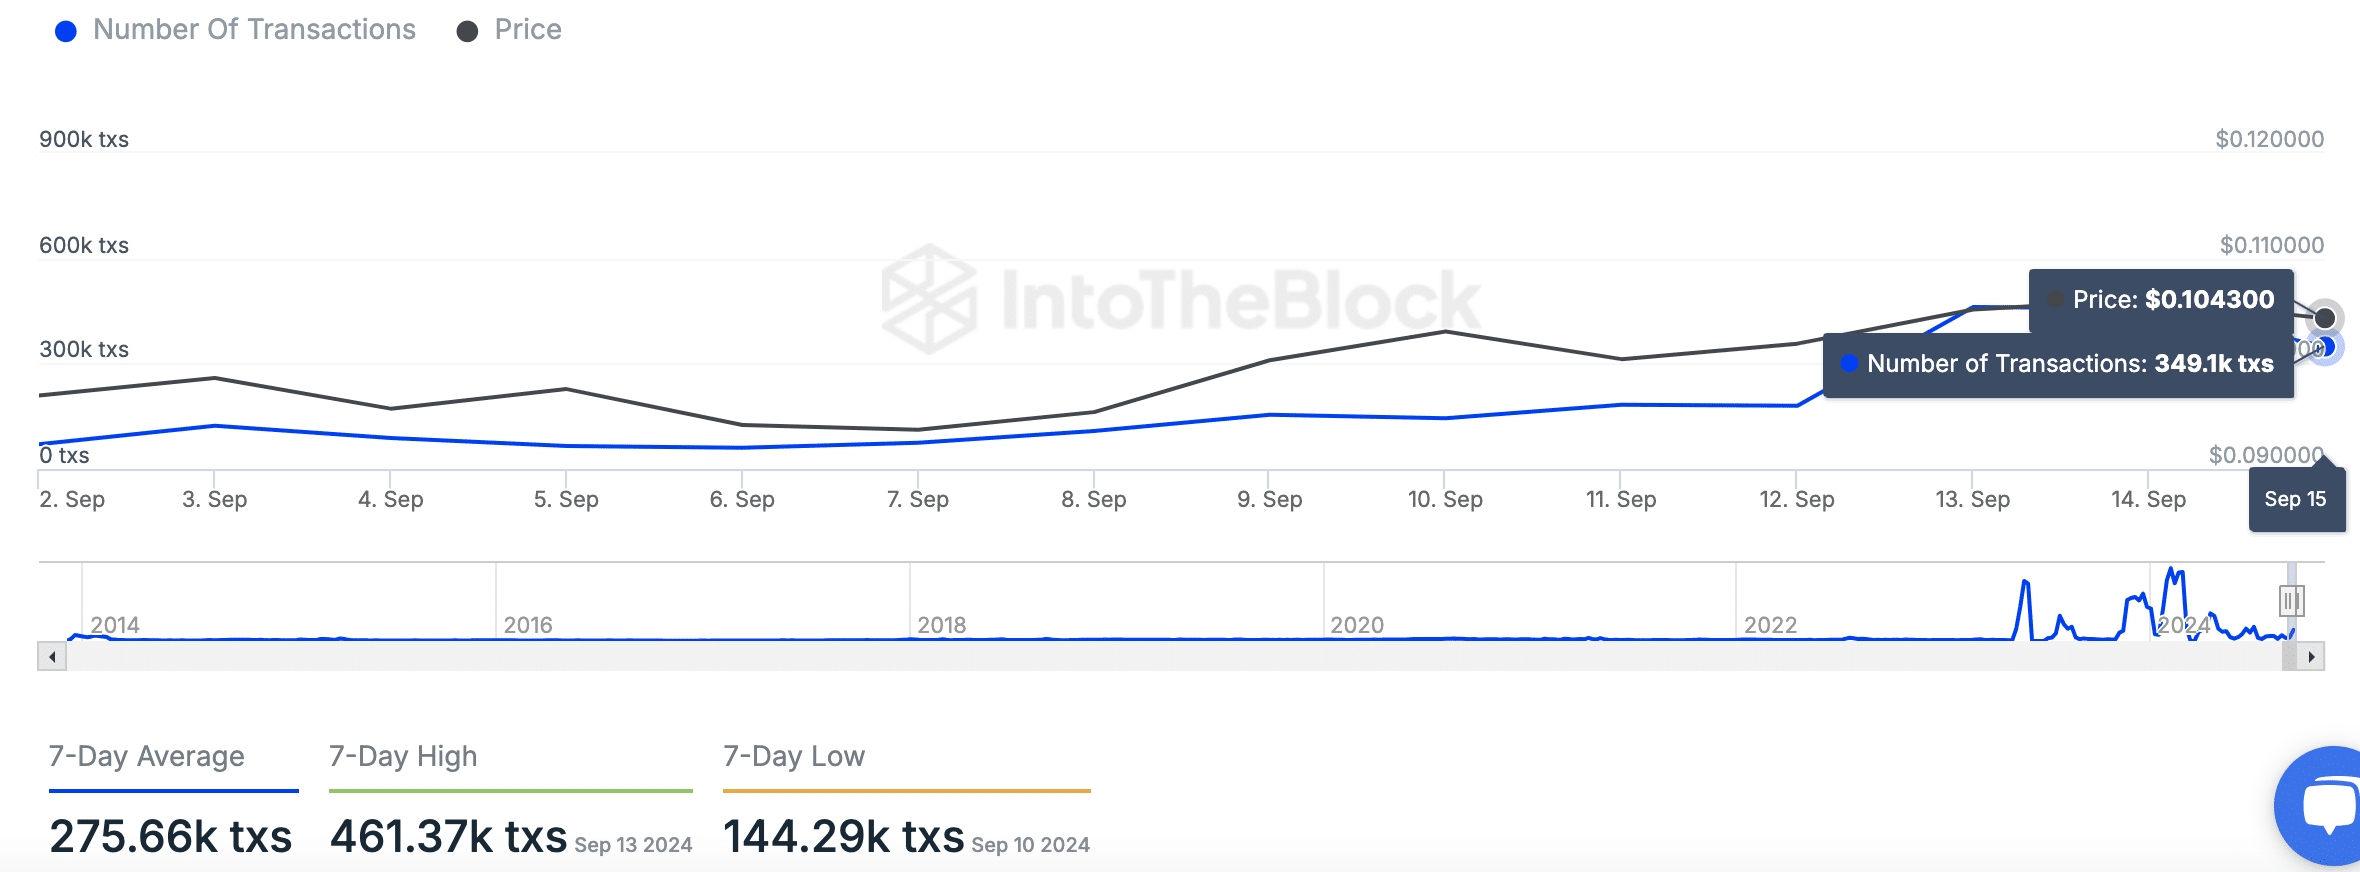
Source: IntoTheBlock
Additionally, Dogecoin saw a net outflow of 2.49 million DOGE from aggregated exchanges, indicating potential accumulation. Over the past 24 hours, the outflow reached 14.56 million DOGE, while the 7-day net flow showed an inflow of 12.24 million DOGE.
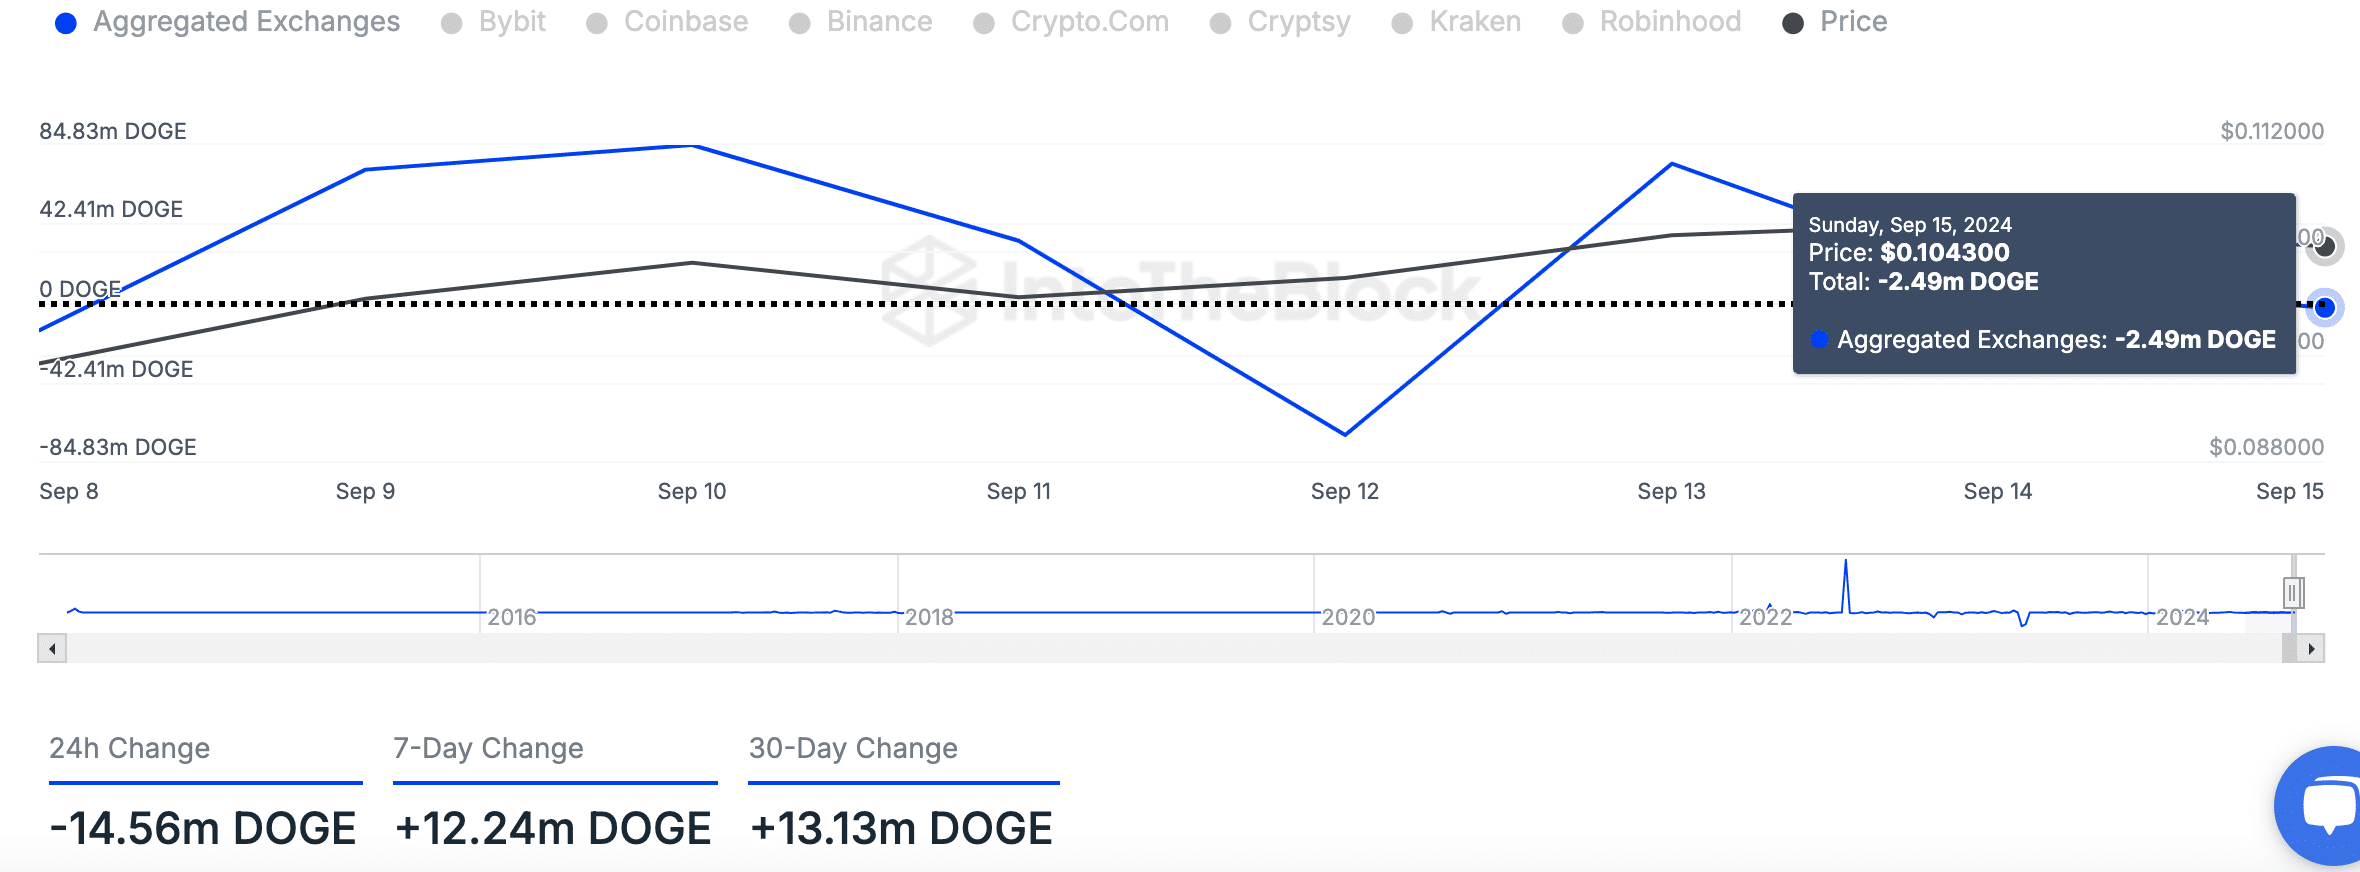
Source: IntoTheBlock
Read Dogecoin (DOGE) Price Prediction for 2024-2025
Despite recent price volatility, this data suggests that large holders may be moving Dogecoin off exchanges, perhaps in anticipation of future gains.
With the $0.1200 level in sight, Dogecoin price movement remains critical.