

- At the time of writing, HYPE’s trading volume on decentralized exchanges has continued to increase, alongside an increase in TVL.
- There was also a confluence between a key support area and the lower band of the Bollinger Bands.
After a week of decline of 12.17%, Hyperliquid (HYPE) has started to recover, posting a gain of 2.22% in the last 24 hours.
While this is a modest increase, AMBCrypto’s analysis suggests that market sentiment favors a stronger recovery in the near term.
Positive momentum for HYPE
At press time, HYPE’s decentralized exchange (DEX) volume and total value locked (TVL) showed significant increases, a sign of healthy development within the ecosystem.
DEX trading volume, which measures the amount of HYPE transactions during a specified period, has started to increase after a brief decline during the holiday period.
According to the latest data from Artemis, trading volume stood at $268.4 million at press time, up from a low of $225.5 million.
This increase in volume, accompanied by a rise in price, often indicates an uptrend. The blue line on the chart, representing the price, reflects this upward movement.
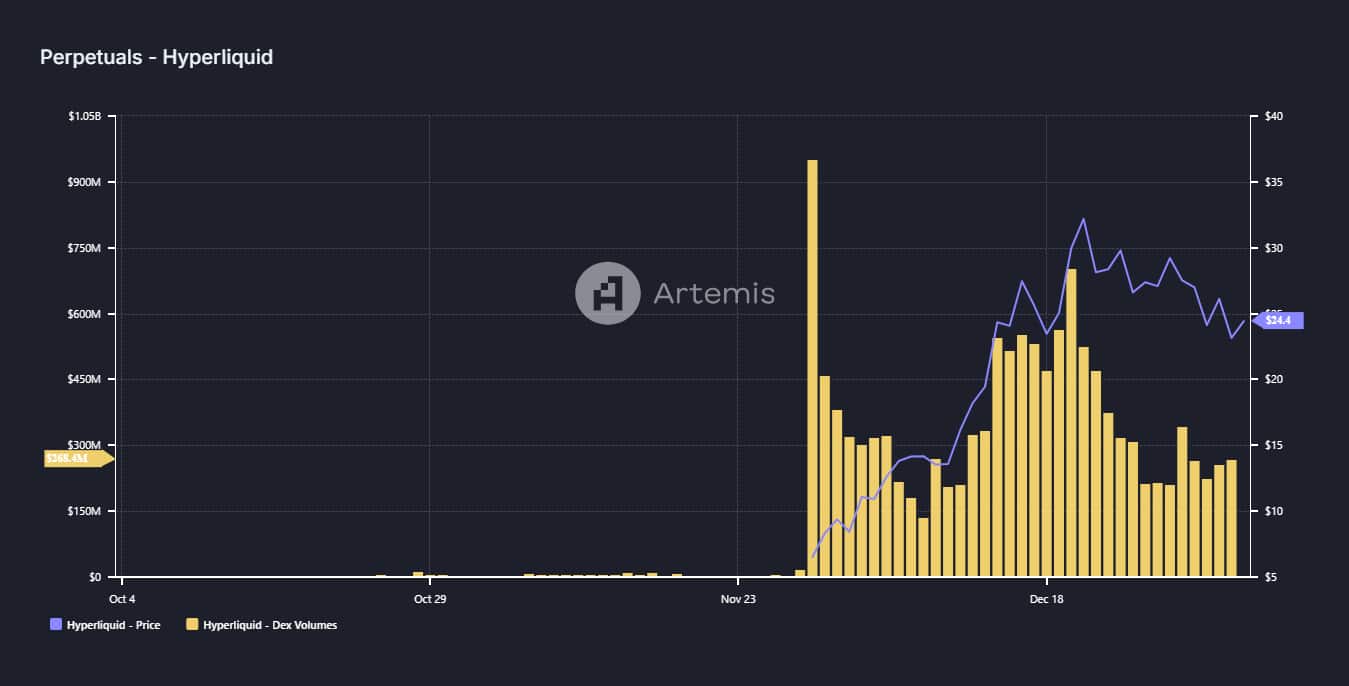
Source: Artemis
Likewise, weekly TVL – a measure of liquidity inflows and outflows within HYPE protocols – jumped. At press time, TVL stood at $2.582 billion, recovering from a decline to $2.221 billion on December 22.
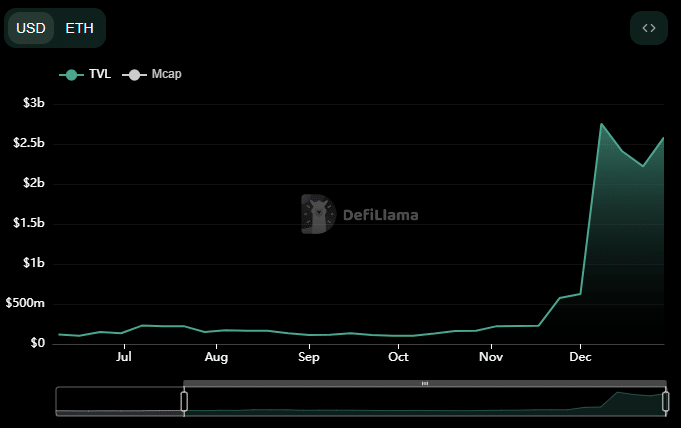
Source: DeFiLlama
Current conditions present a strong buying opportunity for investors, increasing the likelihood of continued bullish market momentum.
Key Chart Alignment: A Potential Push for HYPE
At press time, a key confluence appeared on the chart, as HYPE’s support level within its bullish structure aligned with a critical level: the lower band of the Bollinger Bands indicator ( BB).
The chart shows the formation of a bullish triangle pattern, suggesting a likely upward price movement.
HYPE price has since fallen to this pattern’s support level at $22.646, a level that historically triggers rallies.
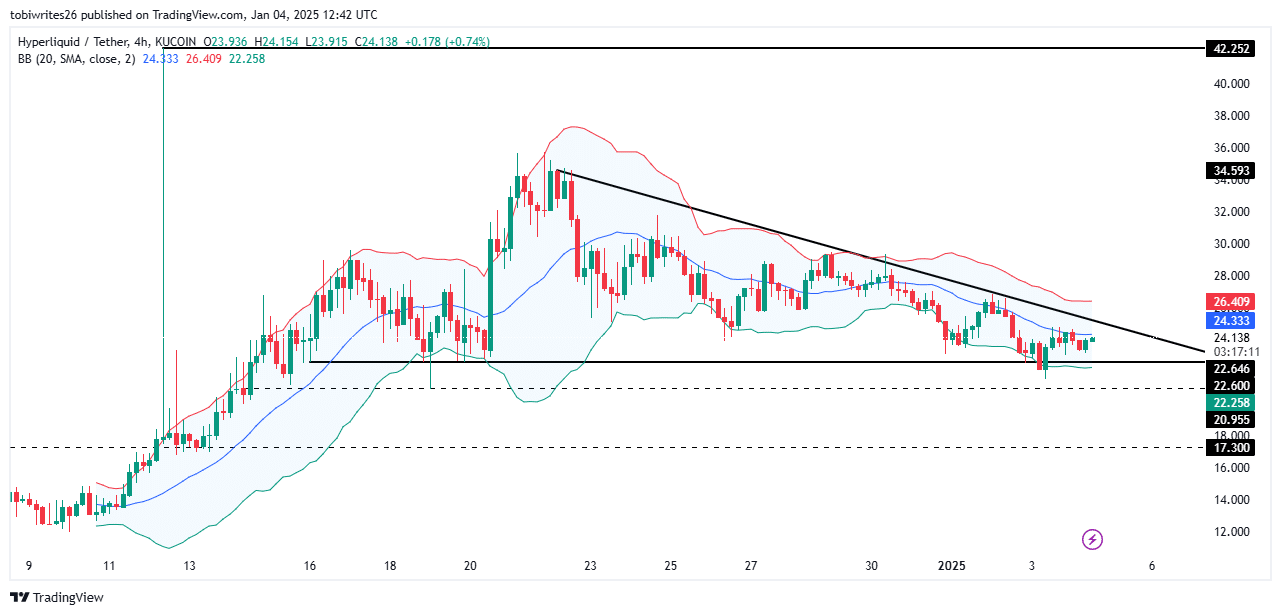
Source: TradingView
This support level also aligns with the lower band of the Bollinger Bands, a technical indicator comprising three components: the upper band (red), the lower band (green), and the middle band (blue), which represents a moving average .
A price decline towards the lower band often shows oversold conditions and rebound potential.
HYPE appears to be following this trend, with a rebound already underway. Strong momentum at this level could push the asset higher, breaking the resistance line of the bullish triangle.
If buying momentum continues to build, HYPE could rebound further, potentially reaching its previous all-time high of $42.
Stock traders are becoming optimistic
According to the Long/Short ratio on Coinglass, which is used to determine whether there are more buyers than sellers in the derivatives market, HYPE was seeing strong bullish sentiment at press time.
A ratio above 1 indicates a bull market, while a value below 1 implies bearish conditions.
Coinglass reported that OKX traders were extremely bullish on HYPE, with a Long/Short ratio of 7.78.
This indicates a higher number of long contracts than short contracts, reflecting strong buying interest and supporting HYPE’s bullish momentum.
Source: Coinglass
Read Hyperliquid (HYPE) Price Forecast 2025-2026
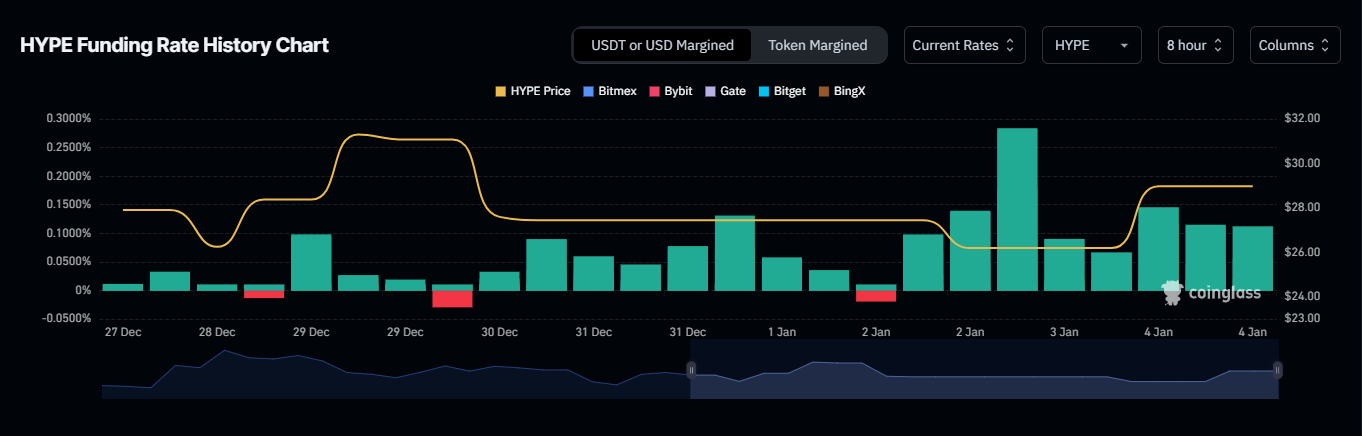
This bullish trend is further confirmed by a sufficiently high funding rate, another key indicator that tracks the balance of long and short positions in the market.
The funding rate of 0.0734% at press time suggested that the bulls were dominating the market as they paid a relatively high premium to maintain the disparity between HYPE spot and futures prices.