

- DOT is breaking out of a falling wedge pattern and showing a bullish hammer candlestick, indicating a possible price rally.
- Open interest is increasing, while the RSI remains neutral, supporting a potential upward move without immediate risk of a pullback.
Polkadot (DOT) is currently experiencing a steady price rebound, posting consecutive weeks of gains.
Over the past two weeks, DOT has increased by 14.2%, and over the past week alone it has seen an 11% increase. At the time of writing, the token is trading at $4.90, reflecting a 2.3% rise over the past 24 hours.
This steady upward price movement is supported by various technical indicators suggesting that DOT could be on the right track. on the brink of a bigger rally.
The Rally Potential of $11
Technical analysis has revealed that DOT’s current price surge is linked to a breakout from a falling wedge pattern, a bullish indicator commonly seen in financial markets.
A falling wedge pattern forms when price action shows a narrowing downtrend, which is usually followed by an upward breakout, indicating a potential trend reversal.
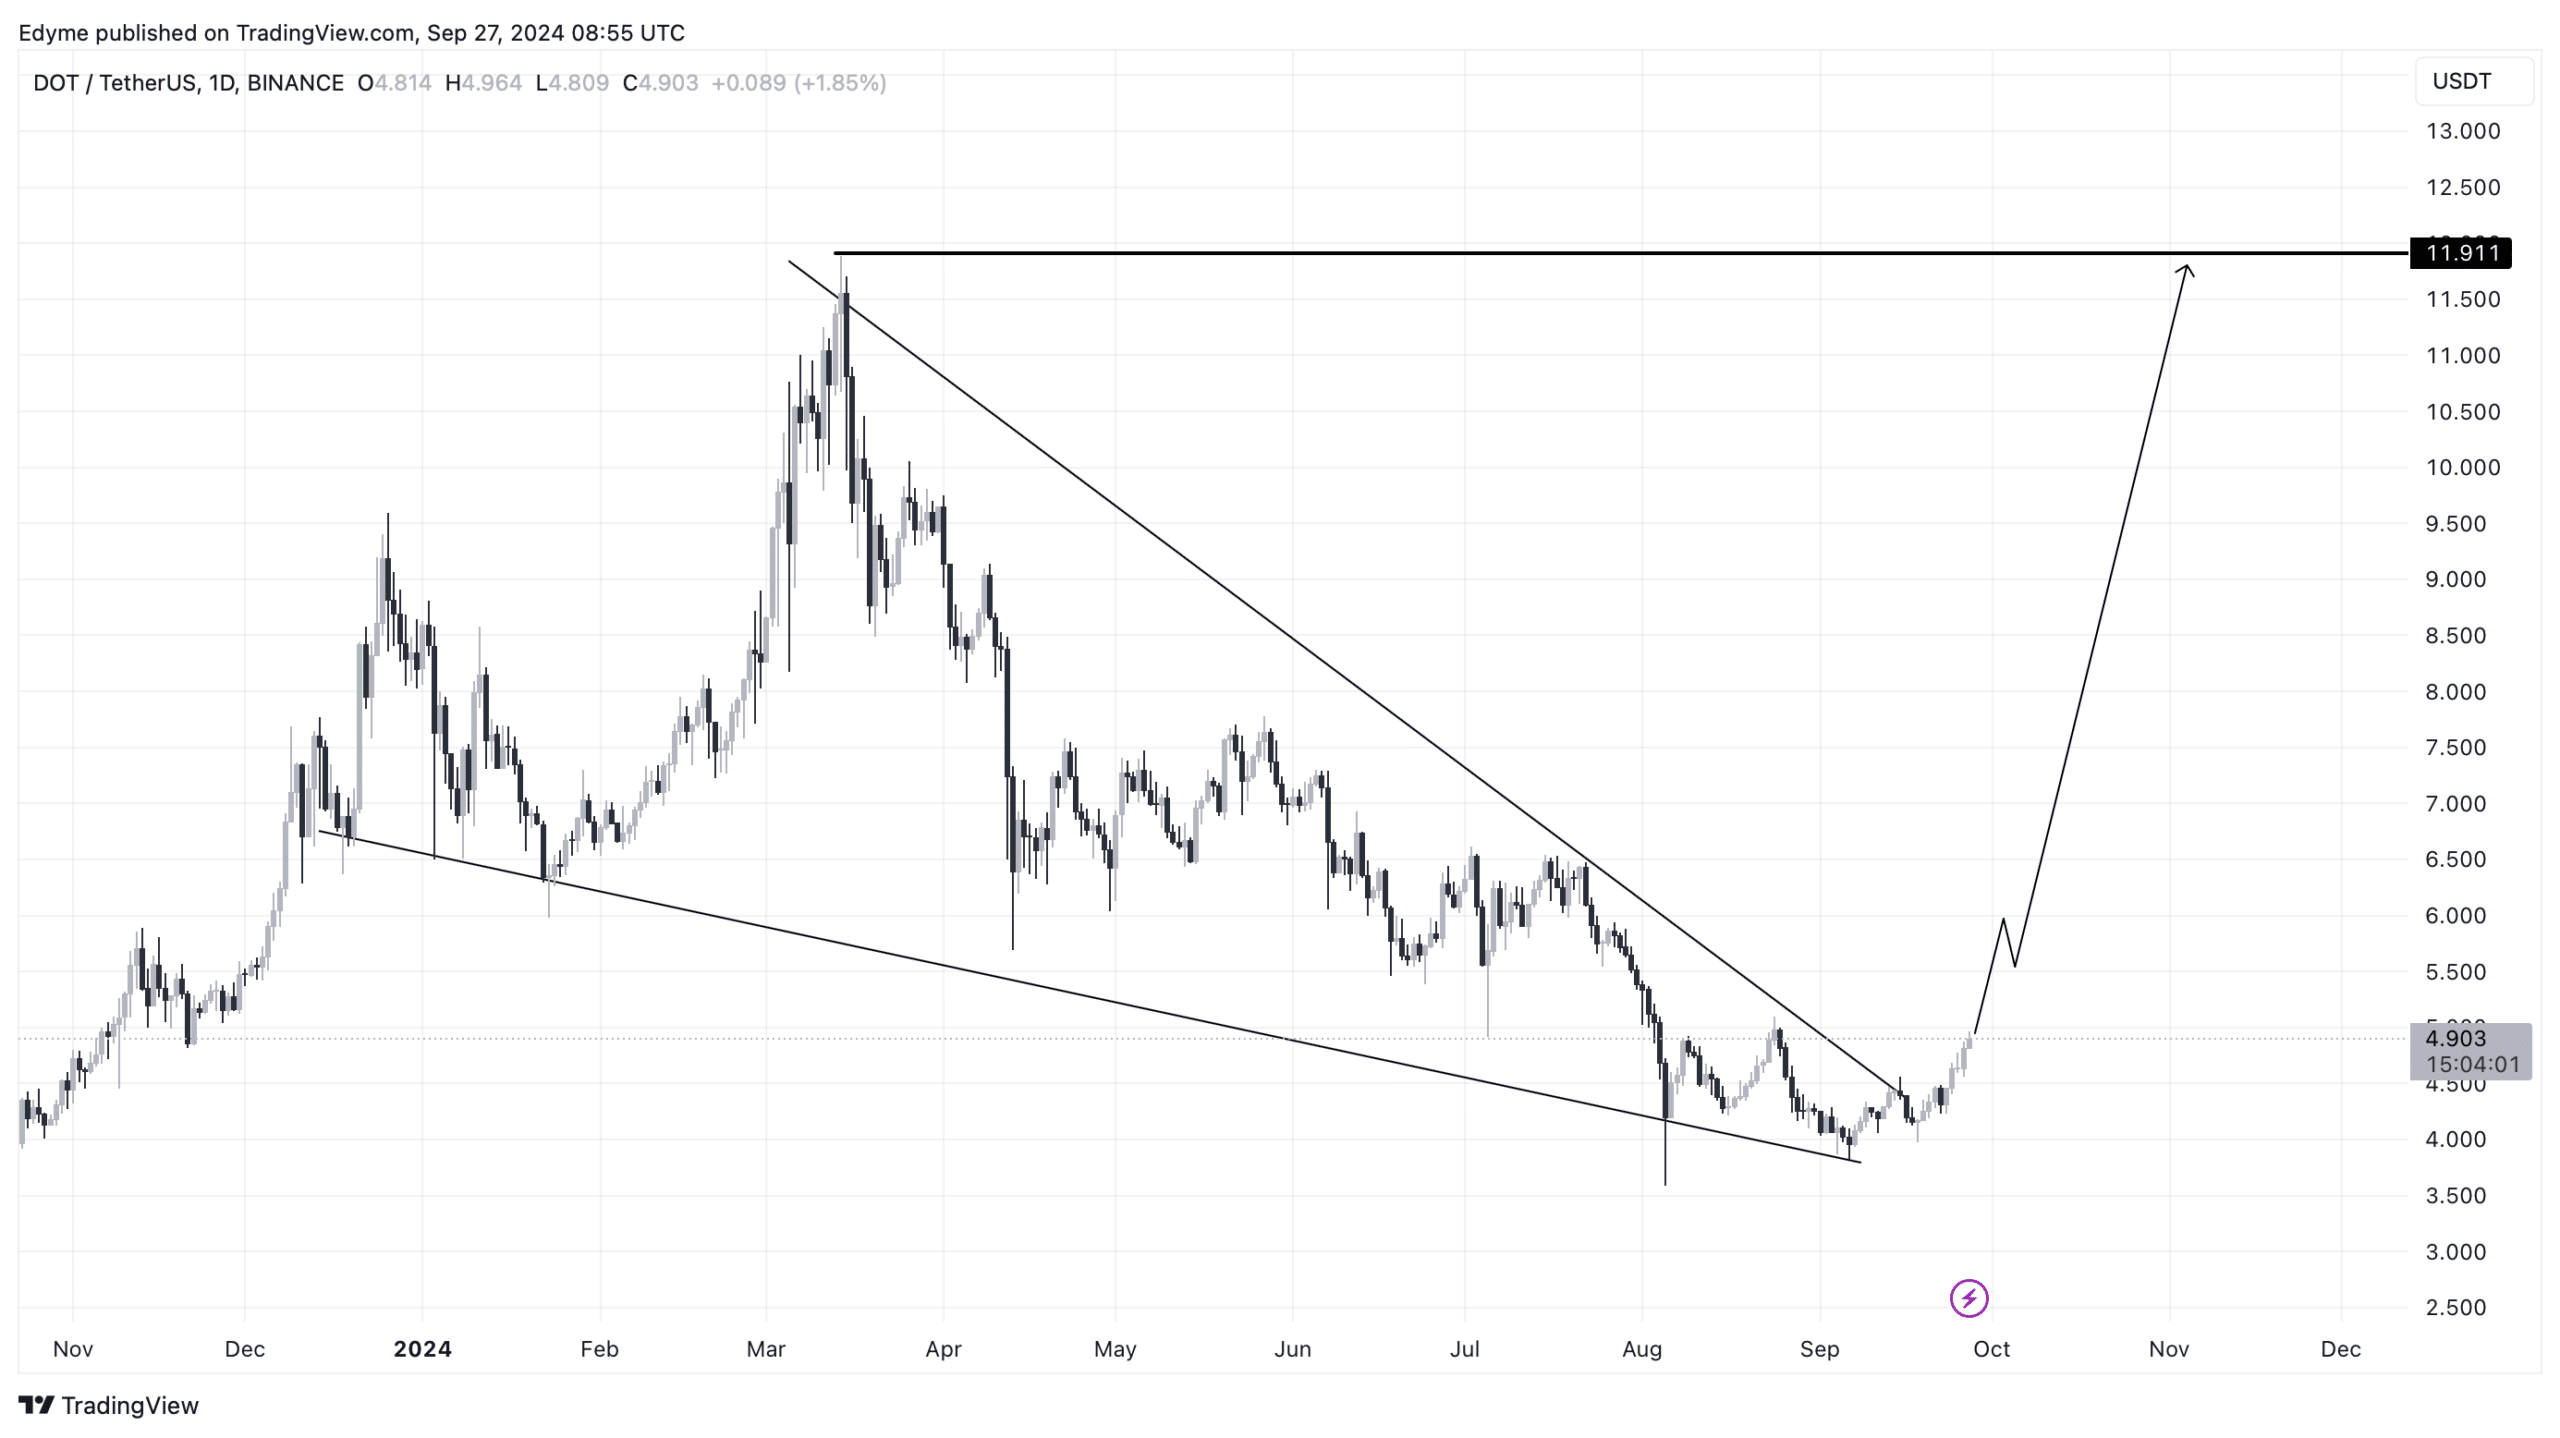
Source: DOT/USDT on TradingView
Now that DOT has broken out of this corner, further bullish momentum is expected.
Although the token remains below the $5 mark, the technical implications of the breakout point to the possibility of DOT climbing to prices above $11 to fully validate this trend.
The appearance of a hammer candlestick pattern on its daily chart further adds weight to DOT’s bullish outlook.
In technical analysis, a hammer pattern is a reversal indicator characterized by a small body and a long lower shadow, signifying that buyers have pushed the price higher after a period of downward pressure.
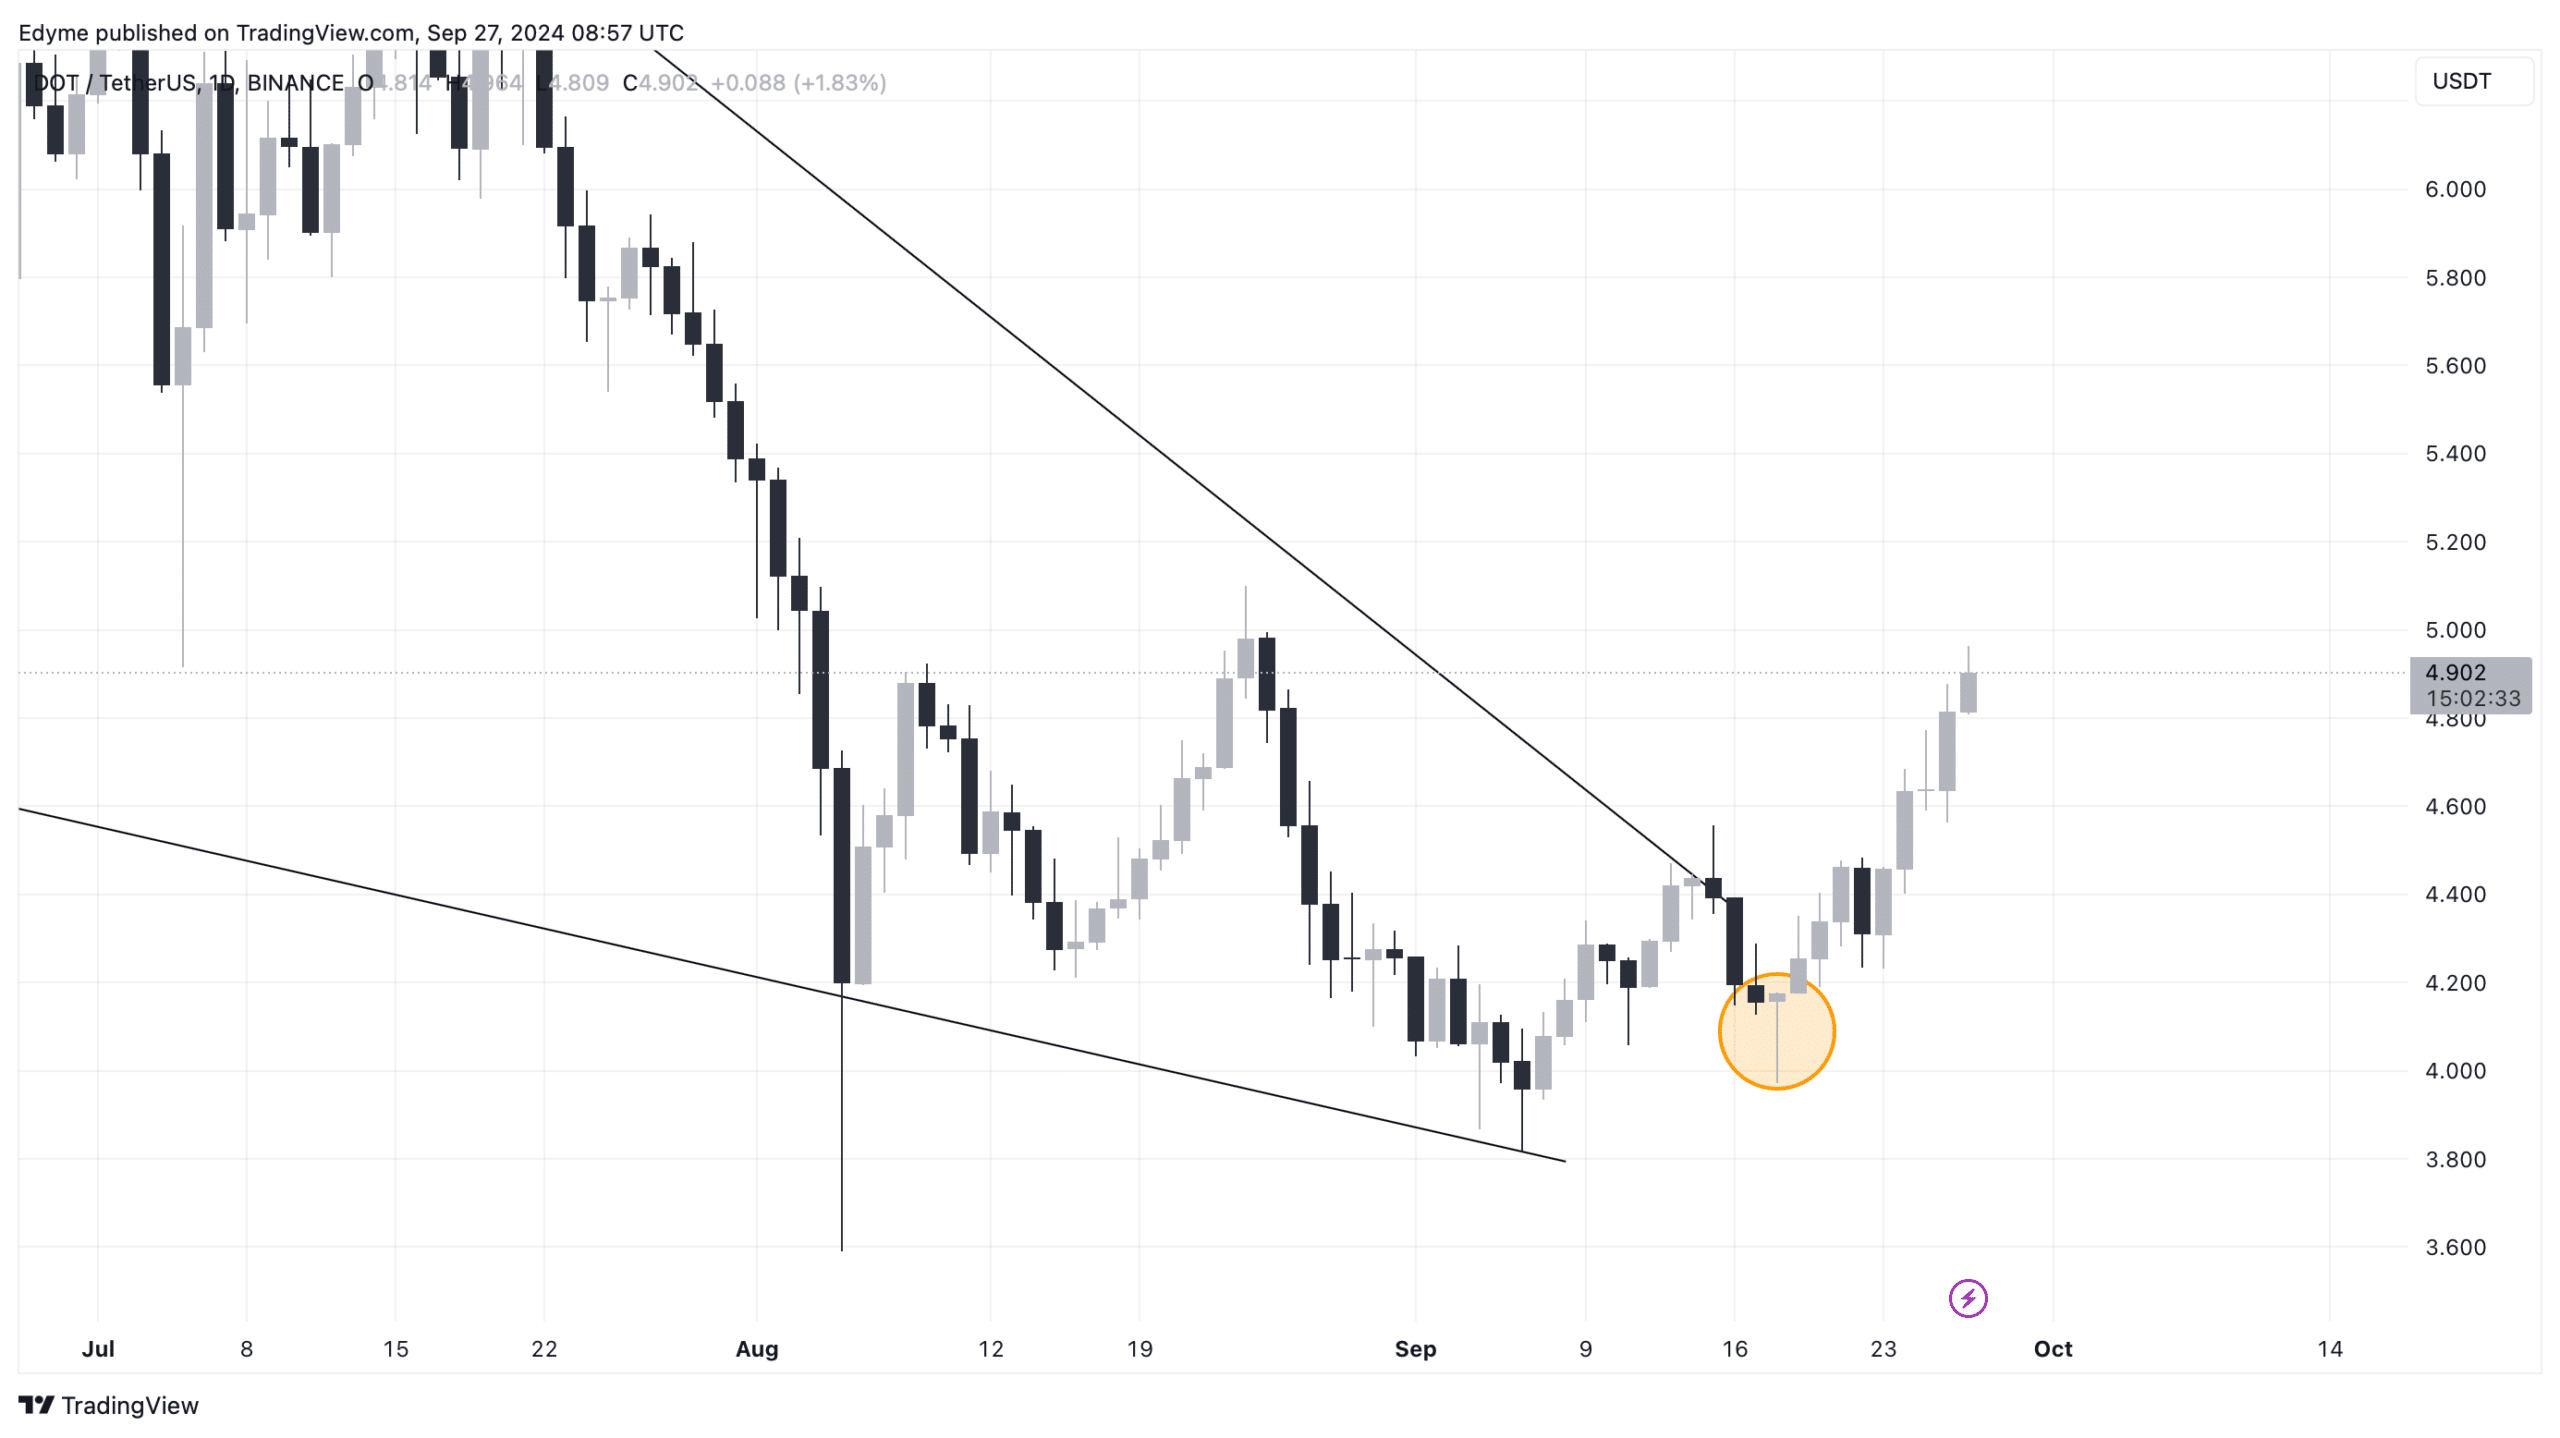
Source: DOT/USDT on TradingView
This is generally interpreted as a positive sign of potential price increases.
The formation of this pattern on the heels of DOT’s breakout from the descending wedge provides further confirmation of bullish sentiment, strengthening the likelihood of a significant near-term rally.
DOT Fundamental Outlook
While these technical signals are encouraging, the question remains whether DOT’s underlying fundamentals support this bullish momentum. To assess this, several key indicators should be looked at.
Data of Coinglass reports that DOT open interest – a measure of the total number of derivative contracts outstanding – increased 3.20% to $233.03 million.
This rise in open interest generally suggests increased market activity and increased interest from traders.
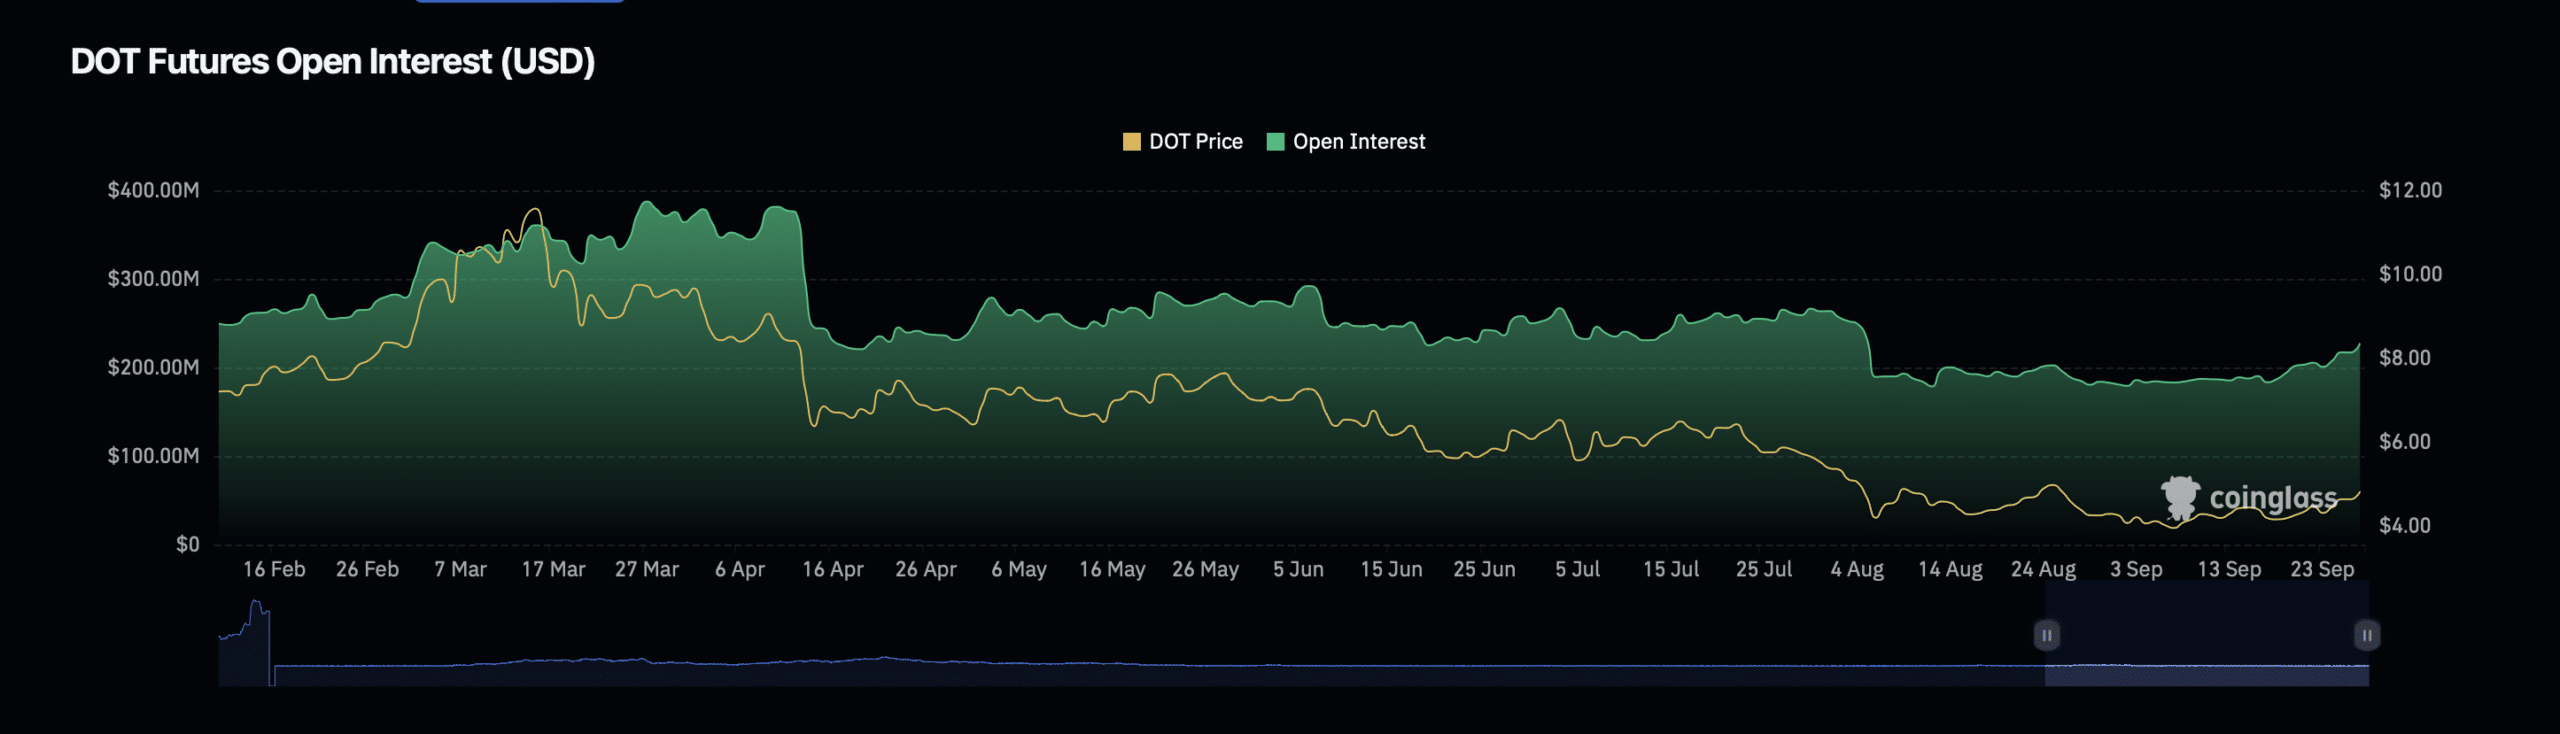
Source: Coinglass
However, in contrast, DOT’s open interest volume saw a decline of 15.16%, now standing at $190.48 million.
A rise in open interest combined with a decline in volume may imply that even as more derivatives positions are established, trading intensity declines, potentially reflecting cautious investor sentiment.
Another essential factor to consider is the Relative Strength Index (RSI), a momentum oscillator that measures the speed and direction of price movements.
Data from CryptoQuant revealed that DOT’s RSI was 68 at press time. This value, below the overbought threshold of 70, suggests that the asset is currently in neutral territory.
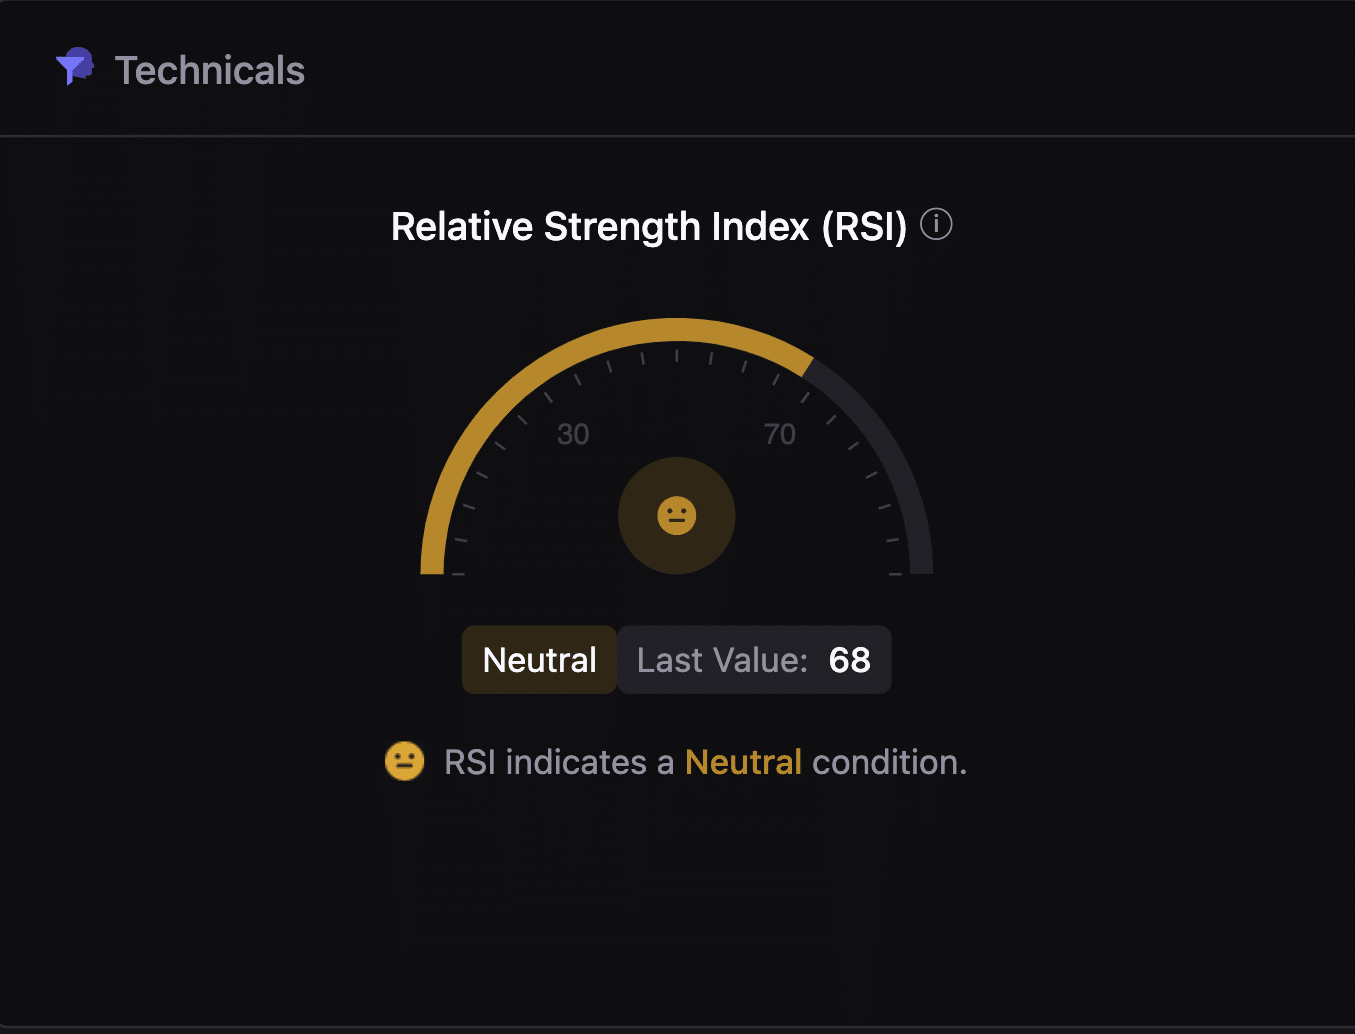
Source: CryptoQuant
Read Polkadot (DOT) Price Prediction 2024-2025
Typically, an RSI below 70 indicates that the price can continue its upward movement without entering an overbought condition that could trigger a pullback.
Therefore, the neutral RSI supported the potential for further price gains, aligning with the technical patterns seen on the DOT chart.