

- Shiba Inu has a bullish structure but is stuck below five-month resistance.
- The daily RSI showed that the momentum was also bullish.
Shiba Inu (SHIB) was stuck below a resistance band at the $0.0000205 region. Previous analysis showed that Shiba Inu maintained a bullish outlook after breaking out of its descending wedge pattern.
The buying pressure behind SHIB is slowly increasing. A break beyond the highlighted five-month resistance should result in a strong upward movement.
Shiba Inu Price Prediction – At Least 40% Gains Ahead?
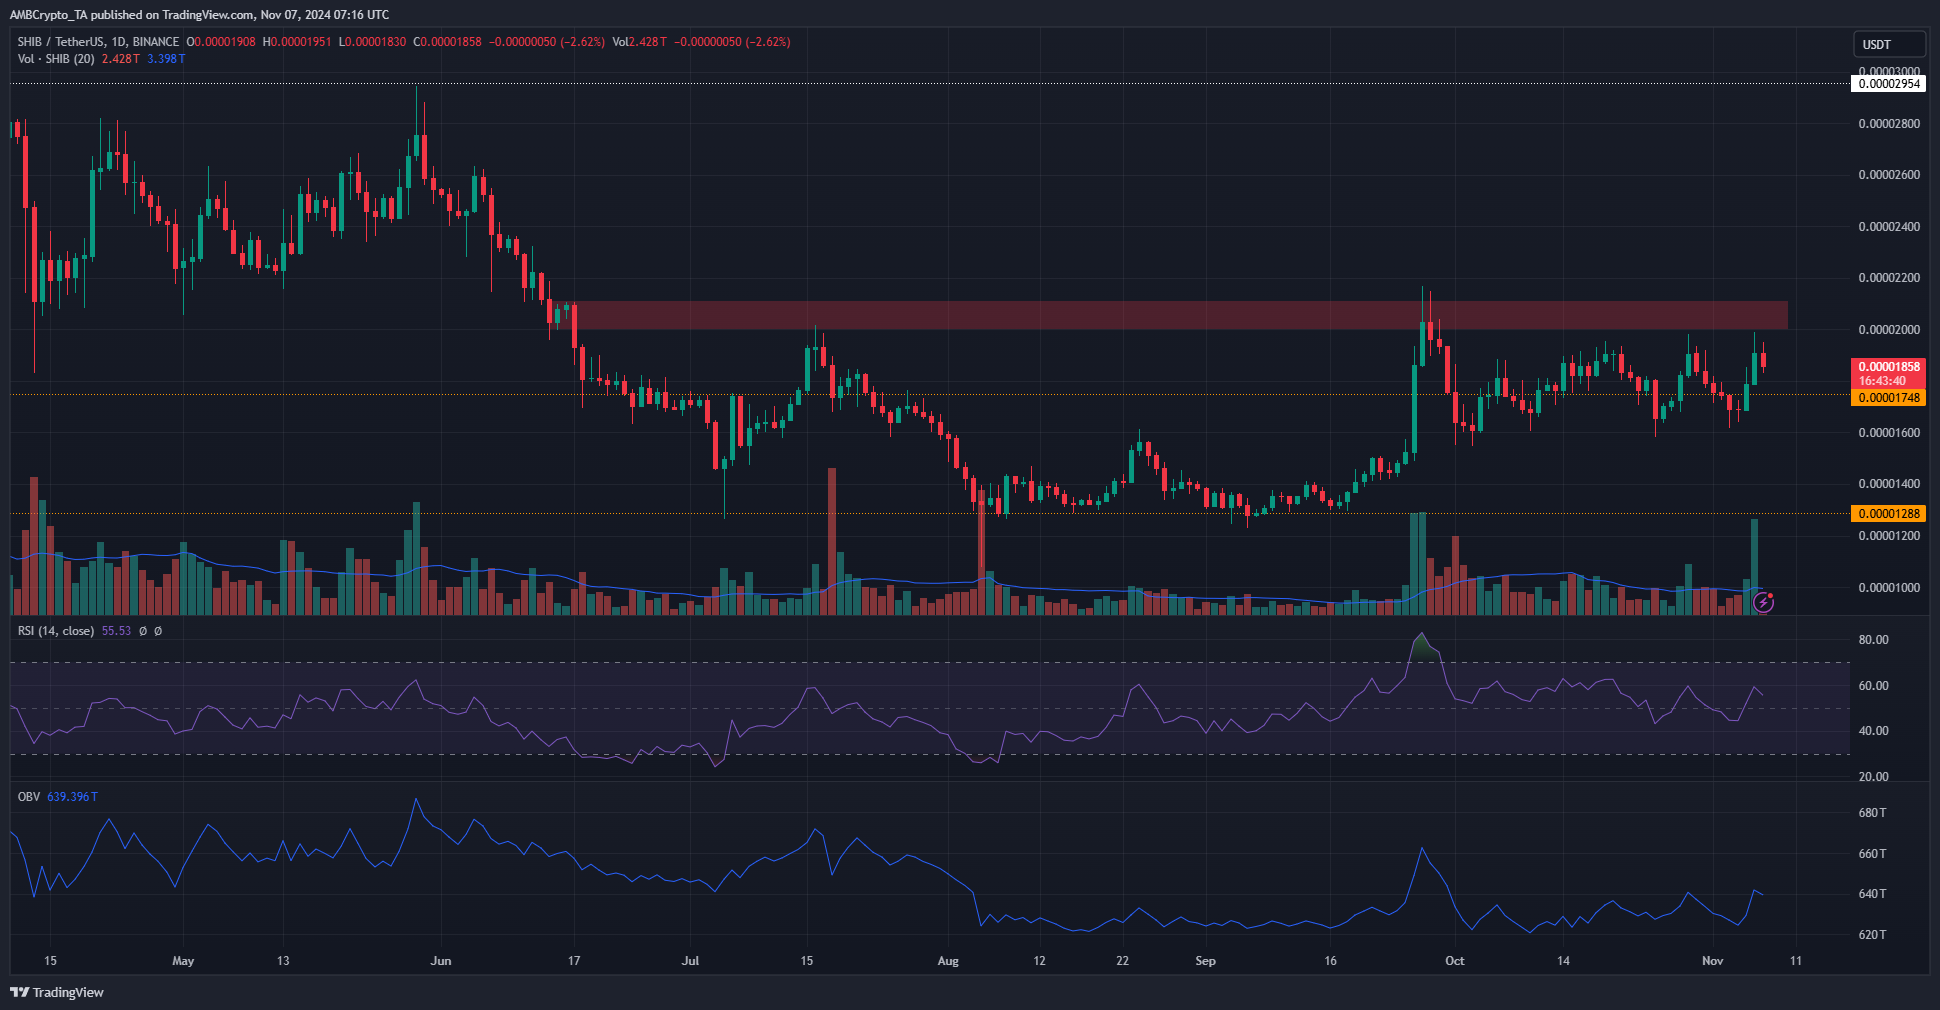
Source: SHIB/USDT on TradingView
At the end of February and the beginning of March, the Shiba Inu rebounded by 389% in ten days. Since then, consistent selling pressure and market-wide bearish sentiment over the summer saw the meme coin enter a prolonged downtrend.
As it stands, the $0.0000155 region has been a support zone since mid-September. The market structure on the daily chart is still bullish and OBV has made higher lows over the past five weeks.
This showed a surge in buyer strength, but did not mean a breakout would occur immediately. Strong Dogecoin (DOGE) may move or meme-related news would cause SHIB to break beyond $0.0000205.
Magnetic Zone Overhead Suggests High Chances of Retest
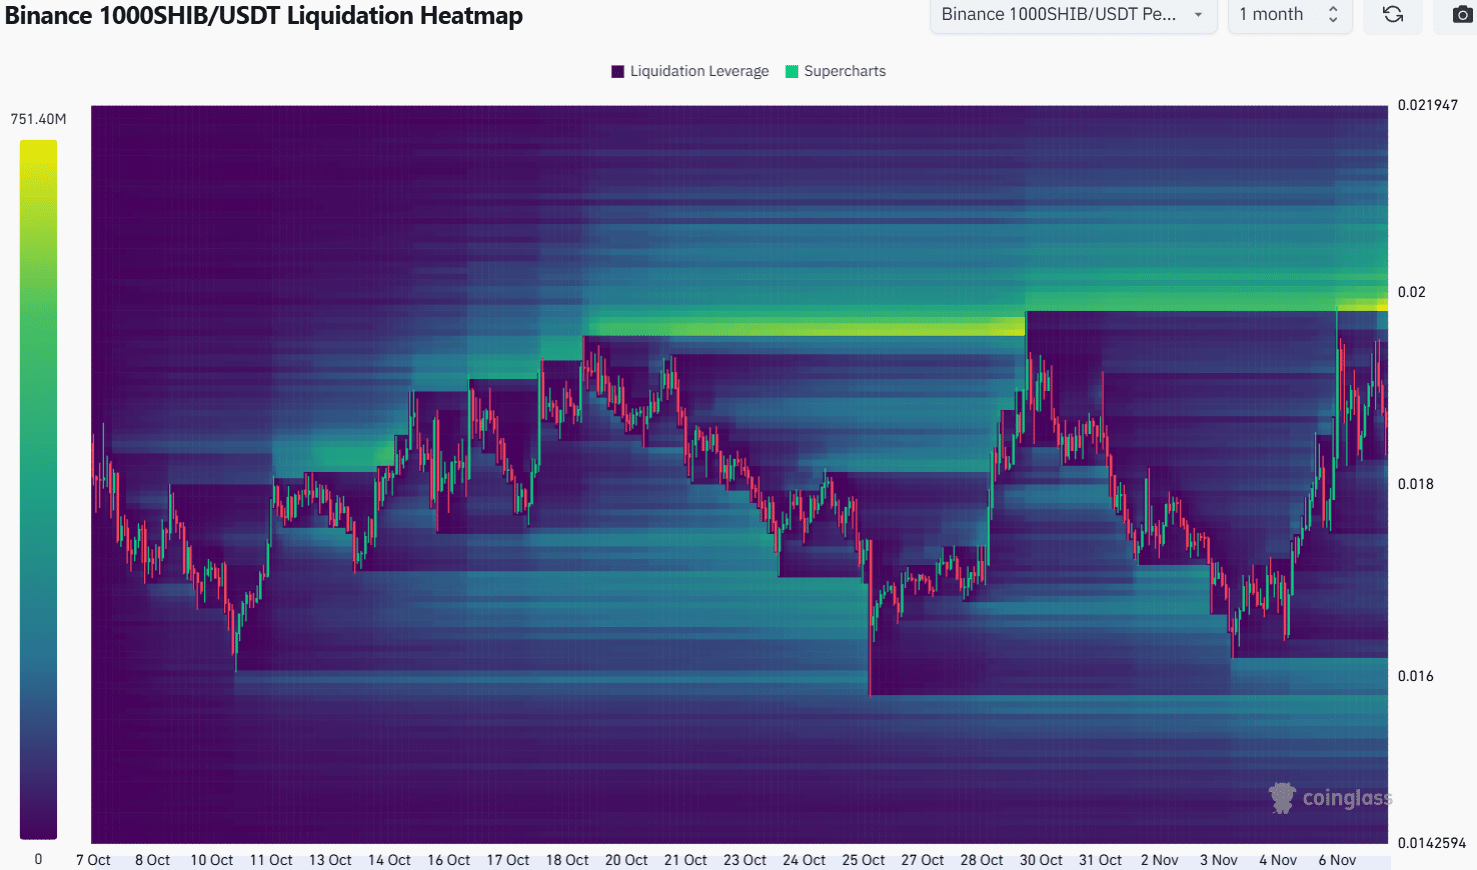
Source: Coinglass
AMBCrypto found that the liquidation heatmap of the one-month lookback period shows a liquidity cluster around $0.00002, reaching as high as $0.0000207. Its proximity to the token’s market prices means that the short-term Shiba Inu price prediction is bullish.
Is your wallet green? Check the Shiba Inu Profit Calculator
A sweep of this liquidity cluster is likely to occur soon, but whether this will result in a breakout remains to be seen. Greater buying volume and a change in sentiment would be necessary.
Traders should be wary of the type of explosive gains that occurred earlier this year in February. Beyond $0.0000205, the 40% higher $0.0000295 level is the next target.
Disclaimer: The information presented does not constitute financial, investment, business or other advice and represents the opinion of the author only.