
 Surge to $32 in the Long Term? Key Signs Point to…")
- The weekly chart indicates that DOT could soon see a substantial rise to $32 if certain conditions are met.
- Individual investors and large-scale holders, known as whales, are expected to propel the price of DOT to new long-term highs.
Although Polkadot (DOT) faced a daily decline of 4.35% and a marginal weekly decline of 0.23%, the outlook for the altcoin remains bright.
According to the weekly timeframe, DOT was at a critical support level at press time, poised to break out of a descending wedge, targeting a peak at $32.
Why DOT Could Surge to $32
The combination of a falling wedge and strong historical support sets the stage for a potential rally.
At press time, DOT was trading at an important support level of $4.001, a point from which prices have already climbed to higher regions. This level is also associated with significant buying pressure.
The bullish sentiment was reinforced by the formation of a falling wedge at this support level. Typically, a falling wedge suggests that an asset’s price is likely to rise once it breaks above the upper boundary of the pattern.
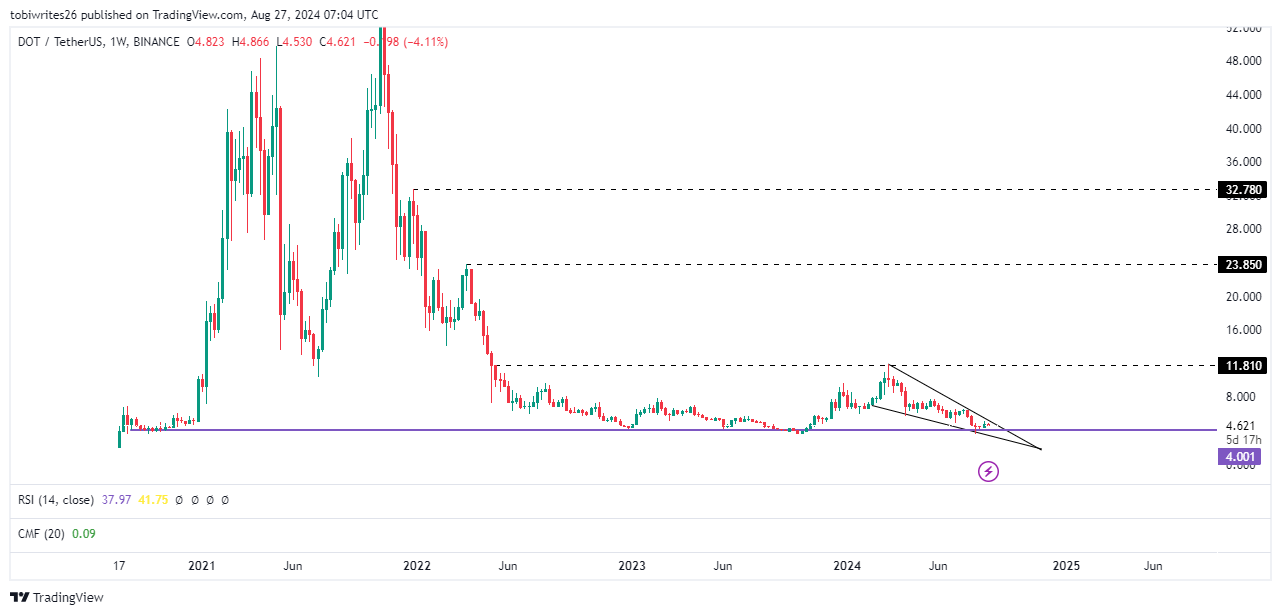
Source: TradingView
If DOT holds its support and successfully breaks above the upper region, three major long-term targets are targeted: $11.810 at the top of the descending wedge, $23.850, and $32.780, where significant liquidity is expected.
Conversely, if the support fails to hold and the descending wedge breaks downward, DOT could potentially reach a new all-time low, falling below $2,000.
An uptrend is on the horizon
AMBCrypto’s technical analysis suggests a potential bullish trend for DOT, using tools such as Chaikin Money Flow and Bollinger Bands to track possible price movements.
Bollinger Bands, defined by trendlines drawn two standard deviations from a simple moving average (SMA) of the asset price, serve as indicators of market movements.
When price approaches the lower band (green), it often signifies an imminent recovery, while proximity to the upper band (red) suggests a potential decline in price.
At press time, DOT was positioned near the lower band, indicating that a rally could be on the horizon and suggesting that the support level at $4.0001 is likely to hold.
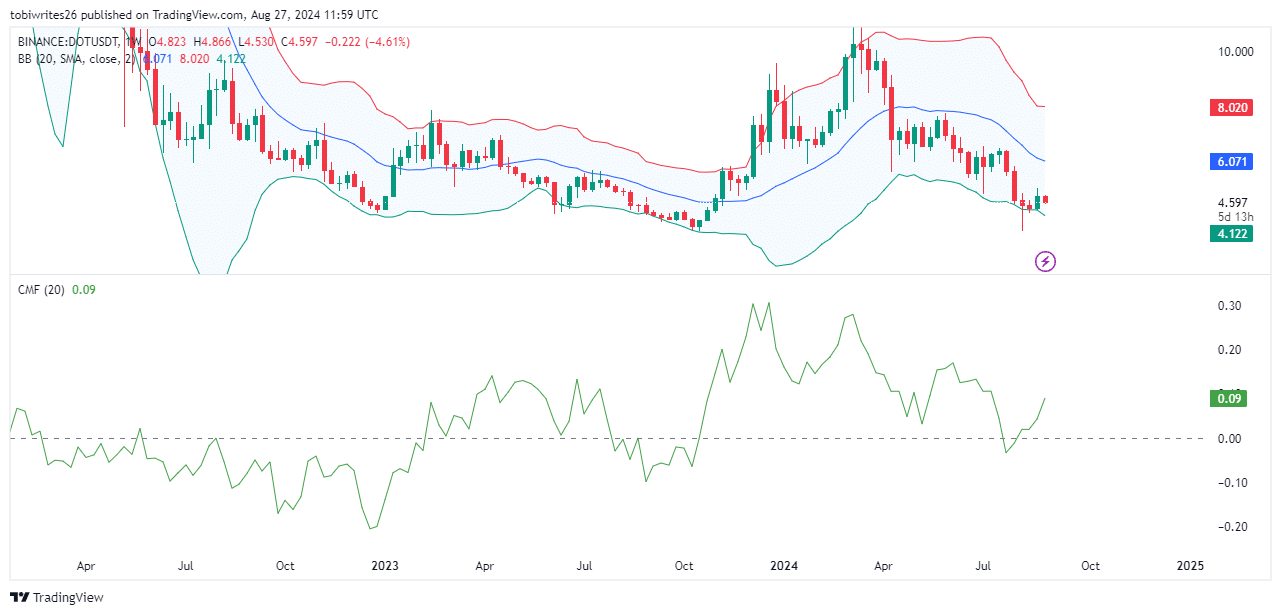
Source: TradingView
Additionally, the Chaikin Money Flow, which measures whether money is flowing into or out of an asset indicating buying or selling pressure, has shown that investment is shifting towards DOT.
An influx of money typically signals an increase in buying pressure, increasing market confidence in the asset and likely pushing the price higher.
Market outlook for DOT remains optimistic
According to data analyzed by AMBCrypto using Coinglass over the past week, there has been a significant outflow from exchanges, with approximately 2.833 million DOT withdrawn.
This negative net flow suggests that DOT holders are moving their assets from exchanges, where they can easily sell them, to more secure wallets.
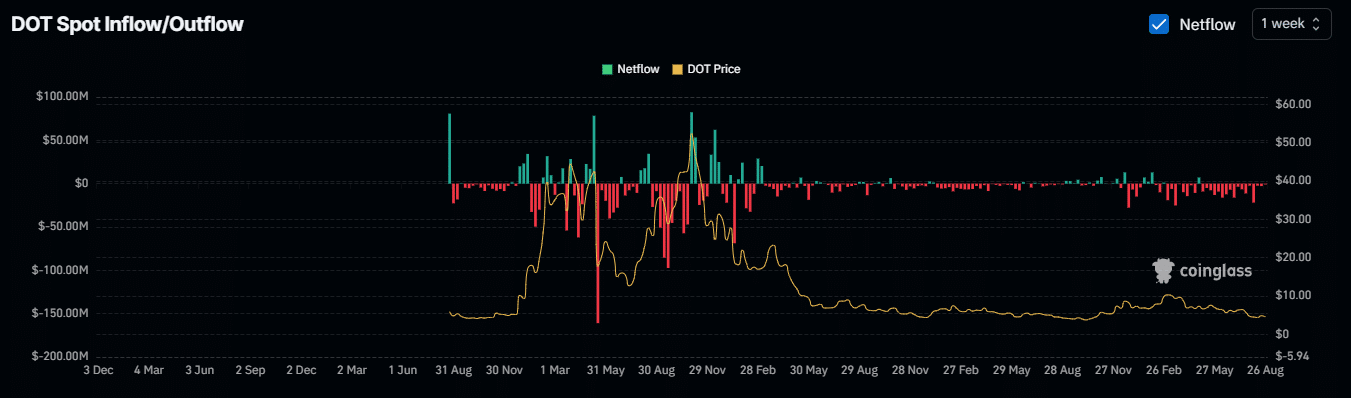
Source: Coinglass
The stock generally reflects bullish sentiment, indicating that investors are optimistic about future price increases and prefer to hold their assets.
Read Polkadot (DOT) Price Prediction 2024-2025
Currently, this trend highlights growing confidence among market participants, suggesting that a recovery could be imminent.
Overall, indicators point to a bullish outlook for DOT, with expectations that it could surge to a long-term price target of $32.