

XRP price is rising from the $0.5250 support. The price could gain bullish momentum if it crosses the $0.5450 and $0.5500 resistance levels.
- XRP price attempts a further increase above the $0.5320 support.
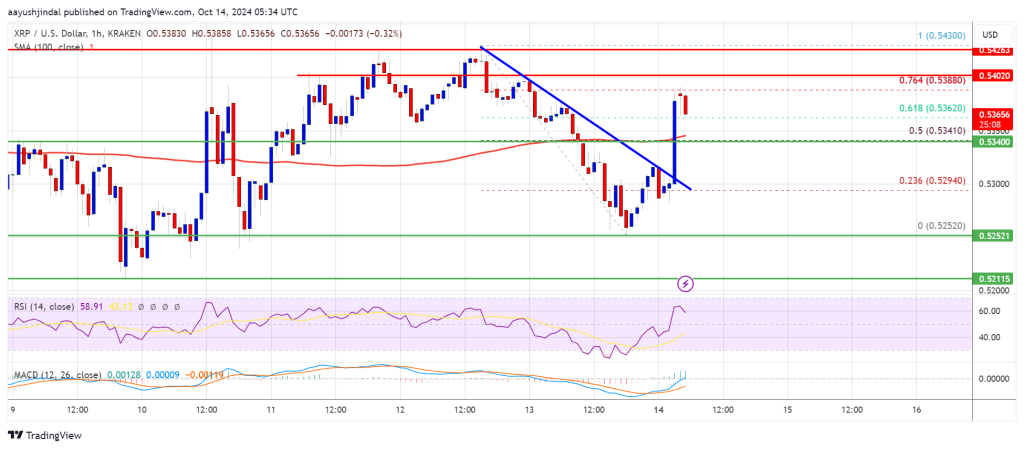
- The price is now trading above $0.5350 and the 100 hourly simple moving average.
- There was a break above a key downtrend line with resistance at $0.5310 on the hourly chart of the XRP/USD pair (data source from Kraken).
- The pair could gain bullish momentum if it breaches the $0.5450 and $0.5500 resistance levels.
XRP price holds key support
XRP price remained stable above the $0.5240 support. A base formed and the price began a further increase above $0.5350 like Bitcoin and Ethereum.
The price climbed above the 61.8% Fib retracement level of the downward move from the $0.5430 high to $0.5252 low. Furthermore, there was a break above a key downtrend line with resistance at $0.5310 on the hourly chart of the XRP/USD pair.
The price is now trading above $0.5350 and the 100 hourly simple moving average. On the upside, the price could face resistance near the $0.5390 level. It is near the 76.4% Fibonacci retracement level of the downward move from the $0.5430 high to $0.5252 low.
The first major resistance is near the $0.5400 level. The next key resistance could be $0.5450. A sharp move above the $0.5450 resistance could send the price towards the $0.5500 resistance. Any further gains could send the price towards the $0.5680 resistance or even $0.5750 in the near term. The next major hurdle could be $0.600, where bears could emerge.
Another decline?
If XRP fails to break above the $0.540 resistance zone, it could begin a further decline. Initial support on the downside is near the $0.5340 level and the 100 hourly simple moving average. The next major support is near the $0.5280 level.
If there is a downside breakout and close below the $0.5280 level, the price may continue to decline towards the $0.5250 support in the near term. The next major support lies near the $0.5120 area.
Technical indicators
Hourly MACD – The MACD for XRP/USD is now accelerating into the bullish zone.
Hourly RSI (Relative Strength Index) – The RSI for XRP/USD is now above the 50 level.
Key support levels – $0.5340 and $0.5280.
Major resistance levels – $0.5400 and $0.5450.