

XRP price started a further increase above the $3,250 level. The price maintains its gains and could begin a further rise if it crosses the resistance at $3.180.
- XRP price traded towards the $3.35 level before correcting some gains.
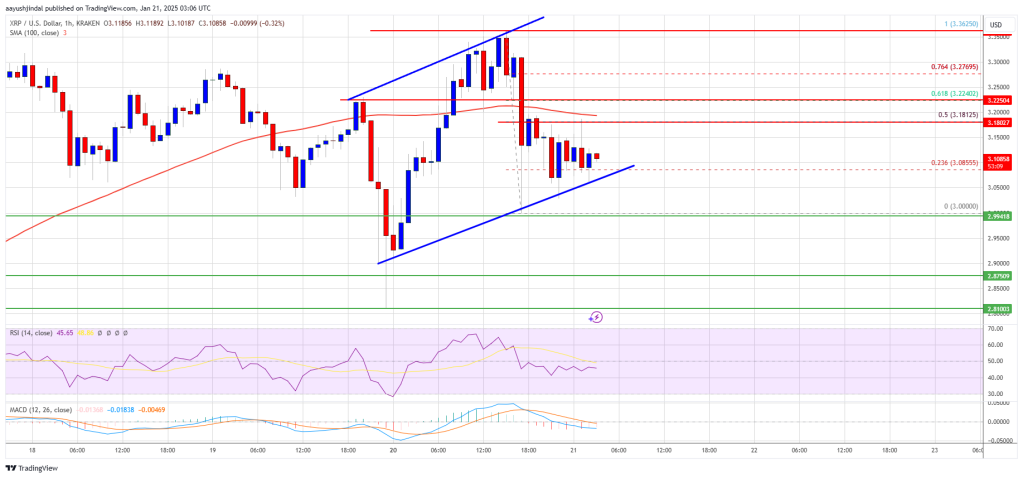
- The price is now trading below $3.20 and the 100 hourly simple moving average.
- A key bullish channel is forming with support at $3.0650 on the hourly chart of the XRP/USD pair (data source from Kraken).
- The pair could begin a further rise if it remains above the $3.00 support.
XRP price maintains support
XRP price managed to initiate a further increase above the $3,050 and $3,150 resistance levels. The price even broke above the $3.20 resistance level but underperformed Bitcoin. A high formed at $3.3625 before a downward correction.
There was a decline below the $3.15 level. A low formed at $3.00 and the price is now recovering. There was a move above the $3,050 level. The price crossed the 23.6% Fib retracement level of the downward move from the $3.3625 high to $3.00 low.
The price is now trading below $3.20 and the 100 hourly simple moving average. There is also a key bullish channel forming with support at $3.0650 on the hourly chart of the XRP/USD pair.
On the upside, the price may face resistance near the $3.180 level or the 50% Fibonacci retracement level of the downward move from the $3.3625 high to $3.00 low. The first major resistance is near the $3.225 level. The next resistance is $3,350.
A sharp move above the $3,350 resistance could send the price towards the $3,450 resistance. Any further gains could push the price towards the $3.50 resistance or even $3.550 in the near term. The next major hurdle for the bulls could be $3,650 and a new all-time high.
Another downward correction?
If XRP fails to break above the $3.20 resistance zone, it could begin a further decline. Initial support on the downside is near the $3.0650 level. The next major support is near the $3.00 level.
If there is a downside breakout and close below the $3.00 level, the price could continue to decline towards the $2.880 support. The next major support lies near the $2,750 area.
Technical indicators
Hourly MACD – The MACD for XRP/USD is now losing momentum in the bullish zone.
Hourly RSI (Relative Strength Index) – The RSI for XRP/USD is now below the 50 level.
Key support levels – $3.0650 and $3.00.
Major resistance levels – $3,180 and $3,220.